Editor’s note: This blog post was originally posted on Jul. 29, 2021 and republished May 25, 2023 to ensure all content and links are up to date and accurate.
For iOS engineers, the following Swift crash reports might look all too familiar.
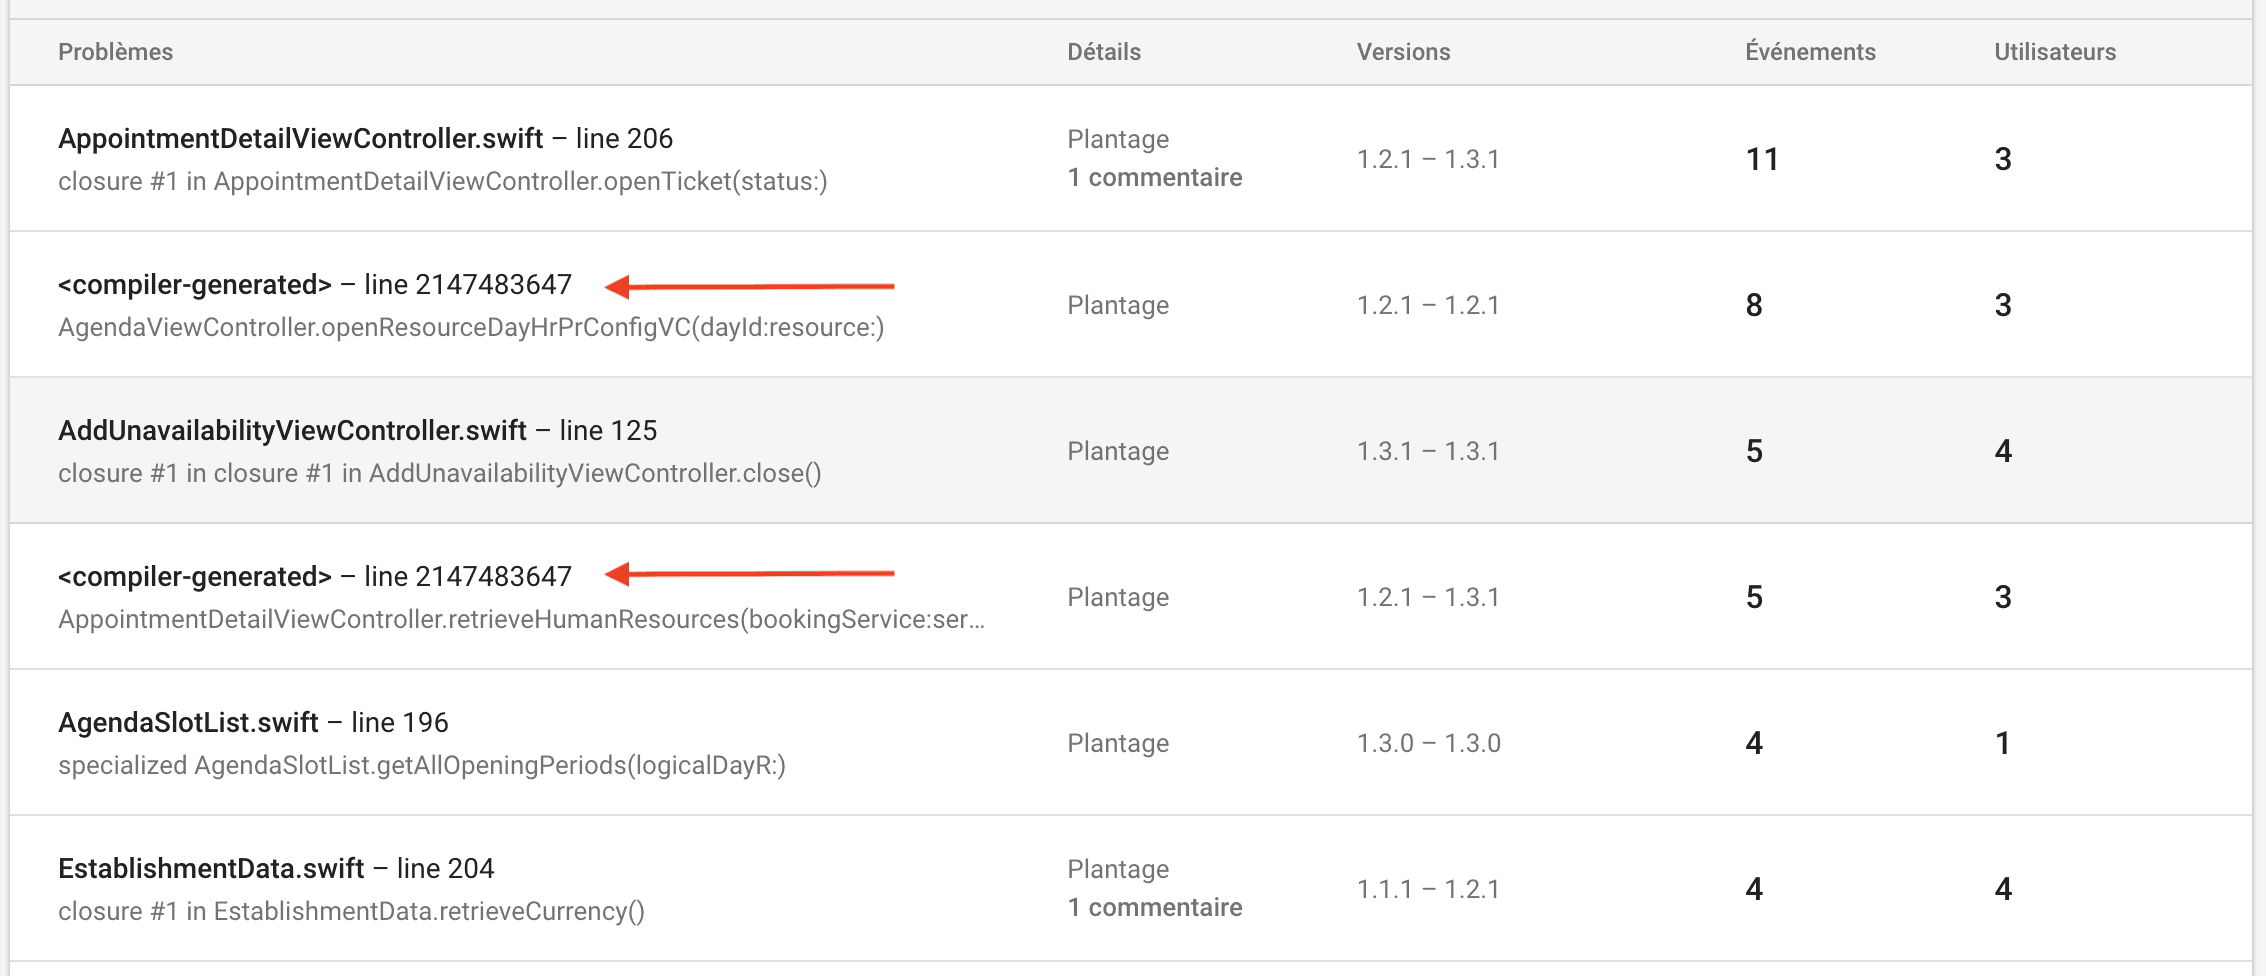
Instead of seeing a file name and line number in your symbolicated stack trace, you’re greeted with an odd entry labeled <compiler-generated>. This is incredibly frustrating, as it doesn’t provide enough information to effectively debug the crash.
In this post, we’ll cover why these entries show up, what you can do to debug them manually, and how Embrace helps automatically find the most relevant file name and line number in these situations.
Why do compiler-generated lines show up in iOS crash reports?
Swift generates a fair amount of code automatically during compile time, and this is undoubtedly a good thing. It allows the language to be more expressive, forgoing imperative instructions for leaner, easier to read code. The Swift compiler is very good at taking human-readable code and transforming it into machine code that executes in the least number of operations so that the code runs as fast as possible.
Some examples include:
- Inlining function calls to reduce call-linkage overhead
- Optimizing loops to improve cache performance and make effective use of parallel processing capabilities
- Generating code to effectively bridge between Objective-C and Swift
In addition, iOS engineers can configure the Swift compiler to optimize for runtime performance at the cost of increased code size (or vice versa). In other words, there is a tradeoff between the level of optimization the Swift compiler can do automatically and the “cleanliness” of the resulting binary. The more changes and transformations the compiler does, the more likely the symbolication process (mapping from memory addresses and offsets back to file names and line numbers) will result in missing information.
What this means is that when symbolicating a crash report with the corresponding dSYM, these <compiler-generated> entries can appear. This doesn’t mean that the code that the engineer wrote was transformed and there was a problem when deobfuscating it. It means that the Swift compiler created brand new code and inserted it into the binary. When trying to translate the symbols back into human-readable form, the symbolication service could only determine that it was compiler-generated.
What can iOS engineers do to debug these issues manually?
Unfortunately, these <compiler-generated> file names are intentionally emitted by the Swift compiler. The compiler produces debug information for the code it generates, which typically includes the file that caused the code to be generated. In other words, <compiler-generated> is added because the code in question simply does not exist in your source code.
There are a few things iOS engineers can do to maximize the debugging information they have for such a crash. First, they can make sure they have a fully symbolicated crash report. After all, any additional missing information only makes the debugging process more difficult. The image below demonstrates a partially symbolicated crash report that only has memory addresses for several frames.
Thread 0 name: Dispatch queue: com.apple.main-thread
Thread 0 Crashed:
0   libswiftCore.dylib                0x00000001bd38da70 specialized _fatalErrorMessage+ 2378352 (_:_:file:line:flags:) + 384
1   libswiftCore.dylib                0x00000001bd38da70 specialized _fatalErrorMessage+ 2378352 (_:_:file:line:flags:) + 384
2   libswiftCore.dylib                0x00000001bd15958c _ArrayBuffer._checkInoutAndNativeTypeCheckedBounds+ 66956 (_:wasNativeTypeChecked:) + 200
3   libswiftCore.dylib                0x00000001bd15c814 Array.subscript.getter + 88
4   TouchCanvas                       0x00000001022cbfa8 0x1022c0000 + 49064
5   TouchCanvas                       0x00000001022c90b0 0x1022c0000 + 37040
6   TouchCanvas                       0x00000001022e7374 0x1022c0000 + 160628
7   TouchCanvas                       0x00000001022df754 0x1022c0000 + 128852
8   TouchCanvas                       0x00000001022df7e8 0x1022c0000 + 129000
9   UIKitCore                         0x00000001b3da6230 forwardMethod1 + 136
10  UIKitCore                         0x00000001b3da6230 forwardMethod1 + 136
11 UIKitCore 0x00000001b3e01e24 -[_UIEstimatedTouchRecord dispatchUpdateWithPressure:stillEstimated:] + 340By following these steps, you should be able to get a fully symbolicated crash report and use the information from the other frames to guide debugging efforts.
You can also manually symbolicate a crash report using some of Apple’s many developer tools, including dwarfdump, atos, and symbolicatecrash. There’s also a helpful talk from Apple from this year’s WWDC called “Symbolication: Beyond the basics.”
If none of these solutions seem too appealing, there is another option that you can consider to get more visibility into <compiler-generated> stack trace entries.
How Embrace helps automatically find the most relevant file name and line number
Embrace symbolicates all iOS crash reports that we receive if you upload the dSYM file to us. Our platform also allows iOS engineers to go from seeing stack traces like this:
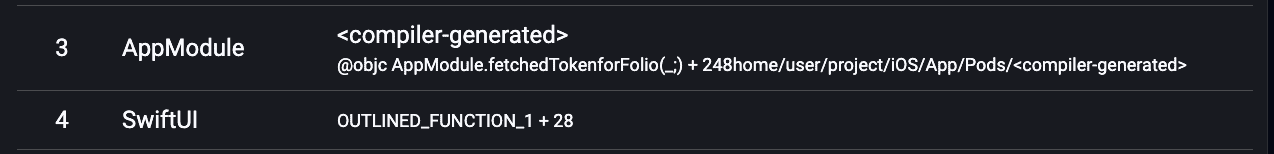
To this:
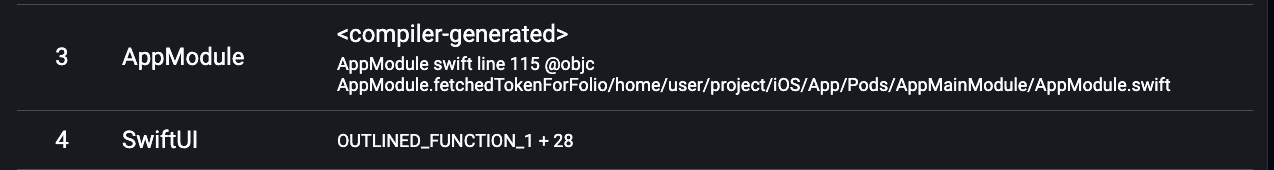
That’s right! Embrace automatically translates the compiler-generated line into the most likely file name and line number. This works for both Objective-C and Swift crash reports. We do this by analyzing the surrounding code to see if we can find code that maps back to a file in the project, and, if this analysis meets certain requirements, we reference this file and line number in the stack trace. While not guaranteed to be the correct line, it will definitely be close and will guide further troubleshooting efforts.
To provide a bit more color (but still simplified), you can picture what we do as taking the memory address and offset for the compiler-generated frame and intelligently searching the surrounding addresses for the closest corresponding line in source code. The goal is to provide as much context as possible for these difficult to solve crashes.
Mobile teams that use Firebase Crashlytics are no doubt familiar with the pain of debugging with compiler-generated lines in stack traces. Now, they can investigate crashes and errors they previously had given up on, and they can do so faster and with more actionable information than ever before.
Summing it all up
Swift is a powerful programming language that allows iOS engineers to write concise, expressive code. The compiler generates a fair amount of code during compile time, which sometimes leads to difficulties when investigating crash reports with <compiler-generated> entries.
Short of digging into the binary files themselves, iOS engineers have not had a great solution for translating these stack trace entries into useful information. With Embrace, they can be automatically pointed to the most likely file name and line number. Our goal is to get you from issue to resolution as quickly as possible, and this functionality allows your team to save time when debugging crashes and errors.
Want to learn more? Explore Embrace today.