grafana

Embrace now integrates directly with Grafana Cloud

Send the mobile metrics and traces you collect via Embrace directly to your Grafana Cloud instance for full visibility into your system's health.

We’re excited to announce that Embrace now integrates directly with Grafana Cloud! As a user of both Embrace and Grafana, you’ll be able to set up our simple data forwarding integration to push metrics and (coming soon) traces directly to your Grafana Cloud instance. 

Prior to this feature, Embrace’s integration was limited to Grafana OSS. This worked via a special Embrace plugin, available in Grafana’s marketplace, that enabled users to create visualizations of their Embrace data in Grafana OSS’s dashboards and panels. The plugin utilized the Embrace Metrics API to pull metrics directly from Embrace’s datastores anytime a user queried them in Grafana OSS. The data transfer relied on Prometheus as the underlying technology layer, and users could query Embrace with PromQL, an intuitive query language that makes pulling metrics quick and easy. You can read up on the Embrace Metrics API in this blog

Many of our customers loved this plugin, so we’ve built an even deeper integration with added benefits. Embrace’s Grafana Cloud integration boasts a few improvements over the Embrace API-based plugin for Grafana OSS: 

  1. No need to write queries. Embrace pushes the metrics you need directly to your Grafana Cloud instance at daily, hourly, or 5-minute intervals. 
  2. Better data access. Once the data is pushed by Embrace, it exists in your Grafana Cloud instance, giving you better access, control, and flexibility with how to use it. 
  3. True end-to-end visibility. For enterprise users, this is a major improvement. Having Embrace data in your Grafana Cloud instance means you can cross analyze your mobile data with any backend monitoring data you’re already sending to Grafana. This gives you full visibility into your app’s health and performance across the entire stack, which is incredibly powerful for troubleshooting. 

Sending metrics and traces

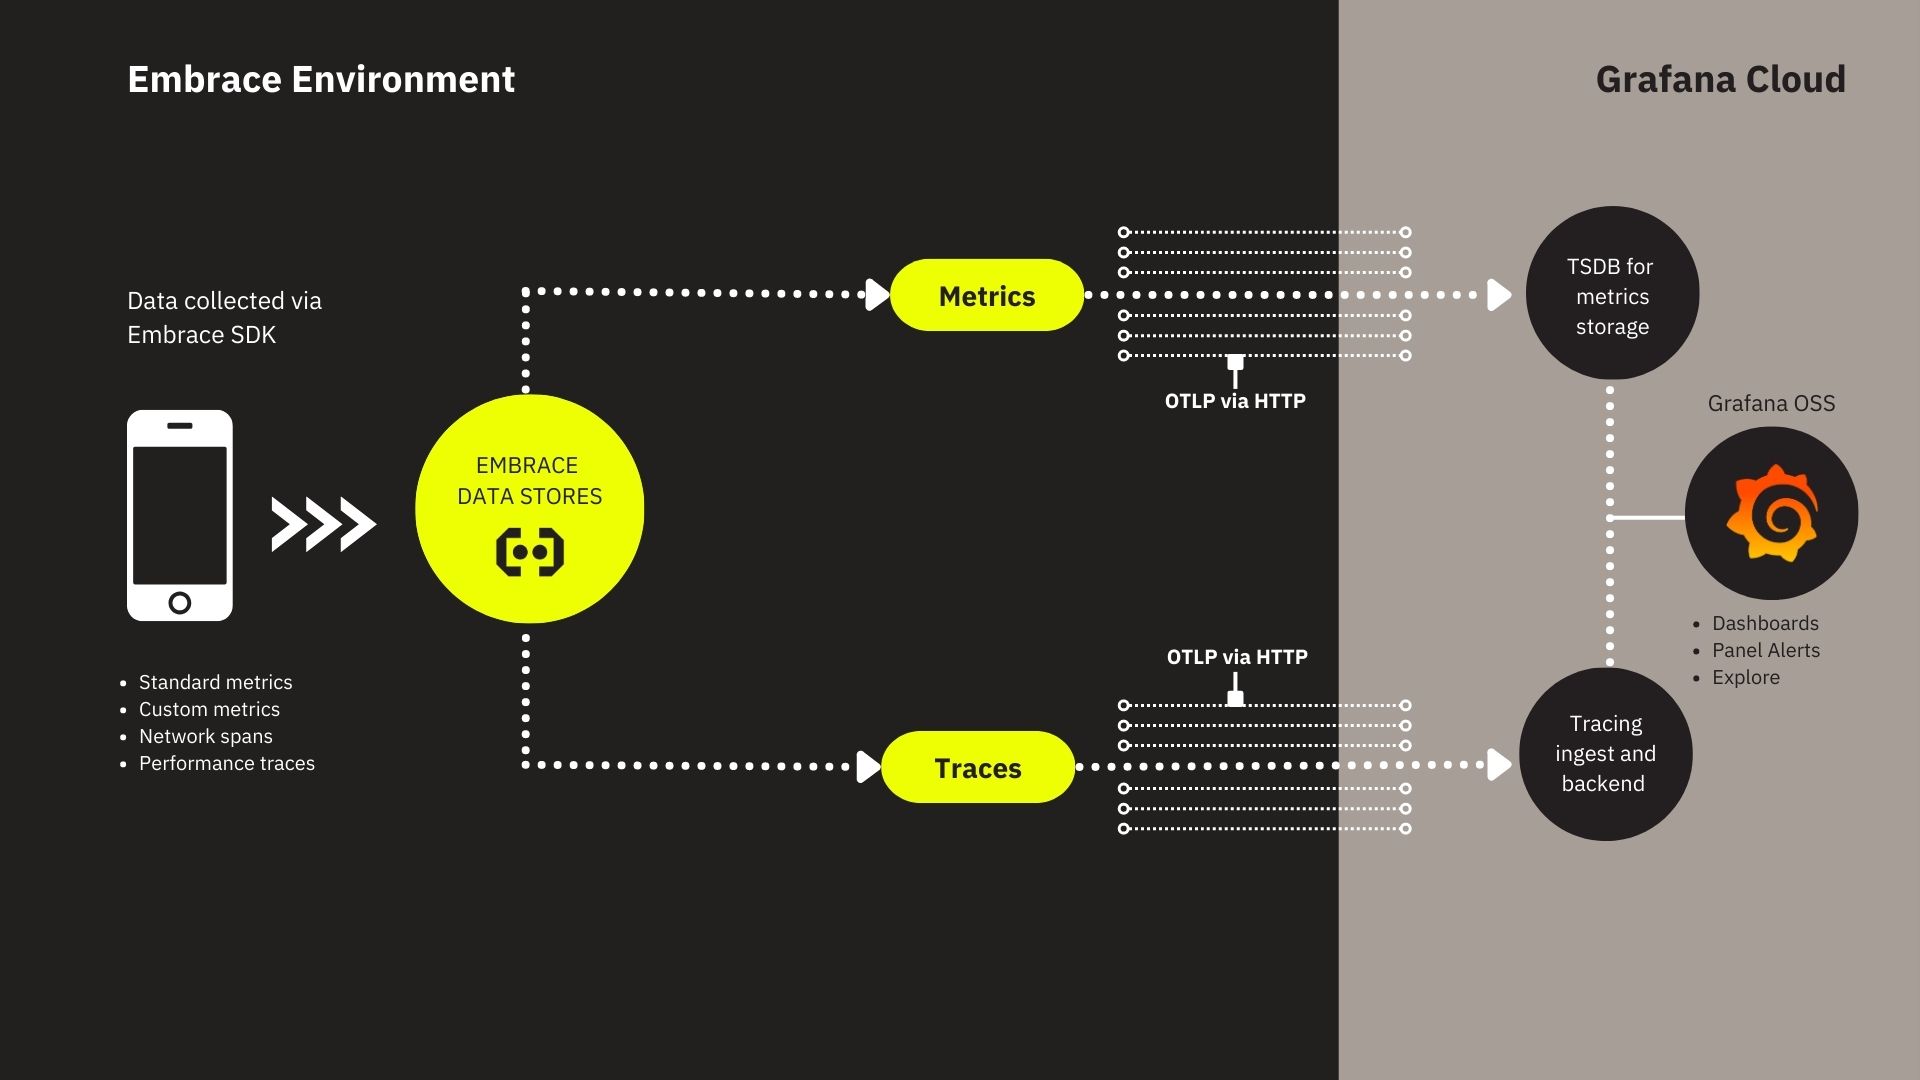
Under the hood, Embrace’s Grafana Cloud integration works by separately pushing metrics to Grafana Cloud Metrics and traces to Grafana Cloud Traces.

Metrics are pushed from Embrace to a time series database for long-term storage for Prometheus metrics using the OpenTelemetry Protocol via HTTP.  Separately, traces are pushed from Embrace to Grafana Cloud Traces, which can ingest traces from a variety of open source protocols, also using the OpenTelemetry Protocol via HTTP. 

From there, Grafana users are able to analyze Embrace data alongside all other data sent to Grafana Cloud, taking advantage of Grafana’s best-in-class visualization capabilities and dashboards. 

Embrace-environment-to-Grafana-cloud-data

Learn more

Embrace’s Grafana Cloud integration is one tool in our suite of Data Forwarding products. As an Embrace user, you can also push metrics directly to Datadog, New Relic, and any other backend solution that is compatible with the OpenTelemetry Protocol. In addition to Data Forwarding, you’ll have access to our Metrics API to query data yourself on an ad-hoc basis or to use when building a homegrown data pipeline and storage solution. 

Interested in trying Embrace out for yourself? Book a demo with a specialist or get started today with a free trial for up to 30 days. 

Embrace Deliver incredible mobile experiences with Embrace.

Get started today with 1 million free user sessions.

Get started free

Build better mobile apps with Embrace

Find out how Embrace helps engineers identify, prioritize, and resolve app issues with ease.