WEBINAR Nov 6: End-to-end mobile observability with Embrace and Grafana Cloud. Learn how to connect Embrace mobile telemetry with Grafana Cloud data.

Sign-up

Getting started with Web RUM: From setup to real insight in 6 steps

Learn how to set up Embrace Web RUM in six simple steps. Capture 100% of real user sessions, analyze Core Web Vitals, and connect frontend performance to real user behavior — all powered by OpenTelemetry.

Most real user monitoring tools stop at metrics.

They tell you page-load times, error counts, and Core Web Vitals — but they don’t explain why users drop off or how to fix it.

Embrace Web RUM was built to close that gap.

It helps frontend teams see performance the way users actually experience it — every session, every flow, every issue — right out of the box.

If you haven’t integrated the Embrace Web SDK yet, start with the Getting started guide.

Once you’re up and running, here’s what you’ll see next — and how to turn data into meaningful user insight.
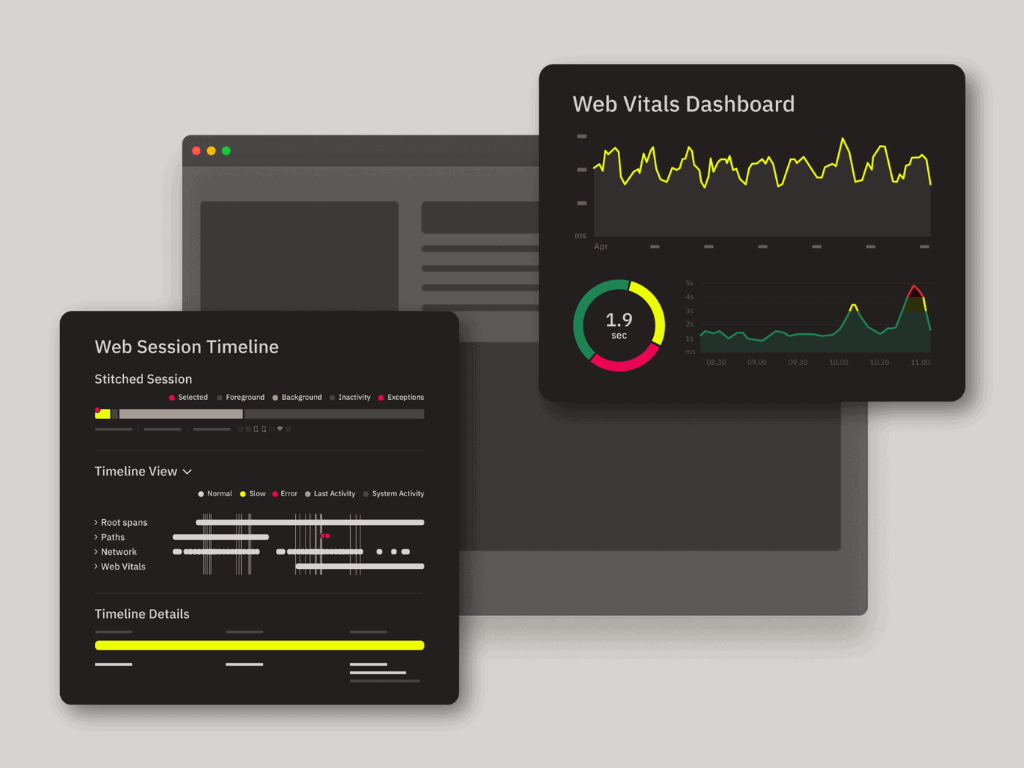
1. See every user session, not just aggregates

Most RUM dashboards show you averages. Embrace shows you real sessions — so you can replay exactly what happened.

You’ll see how stitched sessions combine network requests, logs, Web Vitals, and errors into a single timeline, giving you the full story behind every slowdown or crash.

How Embrace Web RUM captures and stitches real user sessions

 ➡️ Docs: Sessions and Timelines

? Quick win: Once you send your first session data, open the Sessions view and click into a timeline — it’s the fastest way to see how Embrace visualizes real user behavior.

2. Track and analyze performance metrics automatically

Once the SDK is live, Embrace automatically starts collecting page-load performance data and Core Web Vitals — no extra instrumentation required.

Use these views to see how your app performs in the real world.

  • Page Load Insights show which resources (JS, CSS, fonts, etc.) affect latency and caching efficiency.
  • Core Web Vitals (LCP, CLS, INP) reveal how users experience your pages, with element-level attribution so you know exactly what caused layout shifts or delays.

Analyze page-load performance

Track and debug Core Web Vitals

➡️ Docs: Page Load Insights • Core Web Vitals

? Pro tip: Sort the resource table by load time to find blocking assets, then use the “Attribution” panel to pinpoint which element caused the slowdown.

3. Add logs and spans for richer telemetry

After you’ve explored what comes out of the box, add manual instrumentation to connect user behavior with performance outcomes.

  • Logs record high-value events such as “Add to Cart” or “Checkout Started,” with custom attributes for filtering and aggregation.
  • Spans measure performance for key operations like API calls or checkout flows, complete with duration percentiles and slow-span thresholds.

Together, logs and spans tie frontend actions → backend performance → user experience.

Add custom logs

Trace and measure key flows

➡️ Docs: LogsTraces & Spans

? Quick win: Filter logs by property (e.g., browserName = Chrome) to isolate conditions behind an issue, then open the related span to measure latency and error rate in context.

4. Detect regressions with release health

Every deployment introduces change — and sometimes regressions.

With Release Health, Embrace lets you compare versions side by side to see which releases introduced new exceptions, slower loads, or higher error counts.

Analyze page load performance and caching with Embrace Web RUM

 ➡️ Docs: Release Health

? Quick win: Compare your most recent release to the previous one to confirm that key user journeys (like login or checkout) stayed stable.

5. Build custom dashboards and alerts

Every app has its own success metrics. With custom dashboards, you can build widgets for traffic, exceptions, or conversions — and set up alerts to monitor what matters most to your team.

Build custom dashboards and analyze your data with Embrace Web RUM

 ➡️ Docs: Custom Dashboards

? Pro tip: Create an alert for when session counts drop below your baseline. It’s an easy way to catch release issues before users report them.

6. Create and export custom metrics to Grafana

Turn any Embrace widget into a custom metric and send it to Grafana Cloud or another OpenTelemetry-compatible destination.

Forward network spans to trace API calls end-to-end and link frontend behavior to backend performance.

How to create and export custom metrics from Embrace Web RUM to Grafana Cloud

 ➡️ Docs: Custom MetricsGrafana Integration

? Quick win: Use Grafana backlinks to jump from a chart straight into the corresponding Embrace dashboard view.

Key takeaways

  • 100 % of sessions captured for complete context
  • Automatic instrumentation covers Web Vitals, Exceptions, and App Health
  • Understand user flows, not just crashes or averages
  • Built on OpenTelemetry — no vendor lock-in

? Watch the full Getting Started with Web RUM webinar →

Embrace Deliver incredible mobile experiences with Embrace.

Get started today with 1 million free user sessions.

Get started free
Related Content