


No mobile apps are totally free from performance issues, but some fare better than others. This is often due to certain app types needing more memory, better image rendering, more precise location info, stricter security features, etc.
At Embrace, we wanted to explore how these types of factors were impacting app performance across industries. What kind of apps were crashing the most? Which ones tended to eat up memory more than others? To answer these questions, we turned to our own database and built an anonymized ranking system. The full results of this are available in our State of Mobile Experience 2023 report.
As part of this research, we aggregated all of our user app data and grouped it by industry. This allowed us to benchmark mobile performance across major industries through an analysis of key experience indicators. These indicators, which are standard metrics used by mobile engineers to evaluate how good of a user experience their app is delivering, consisted of the following:
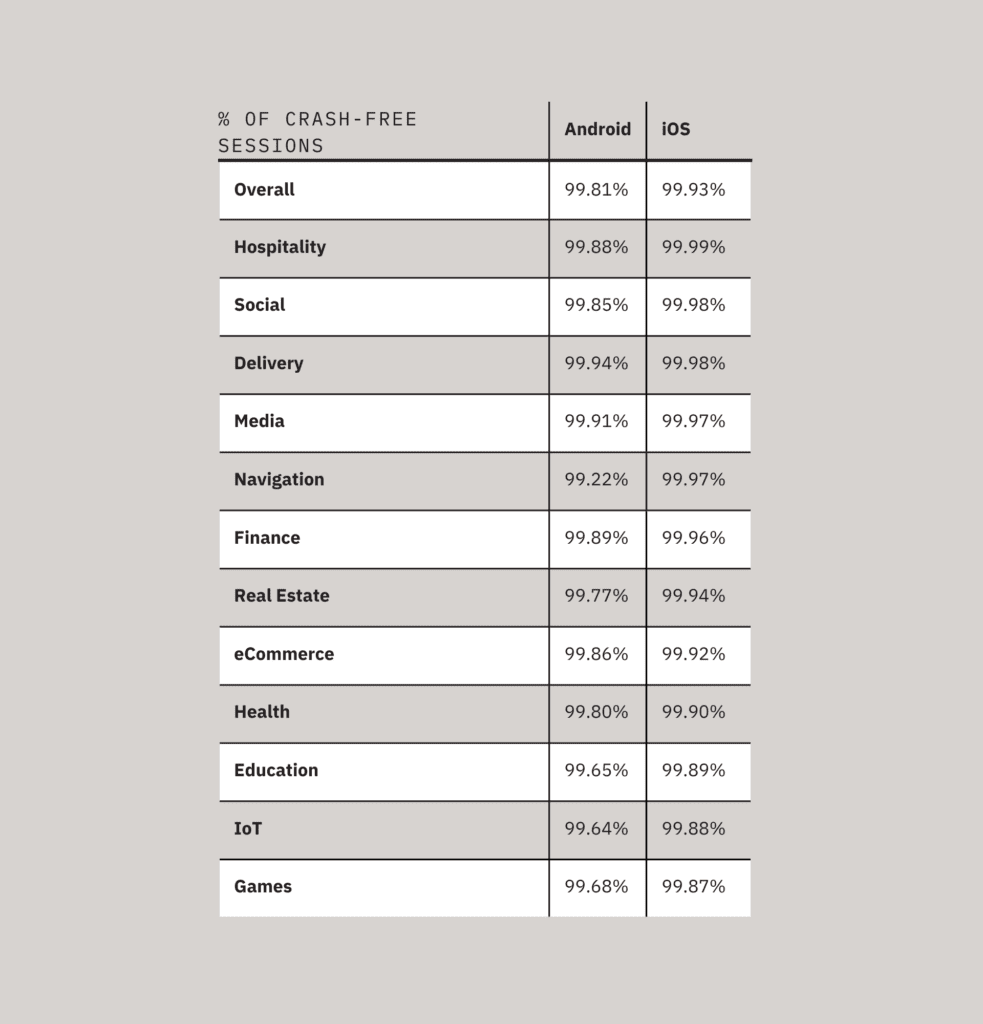
- Percentage of crash-free sessions
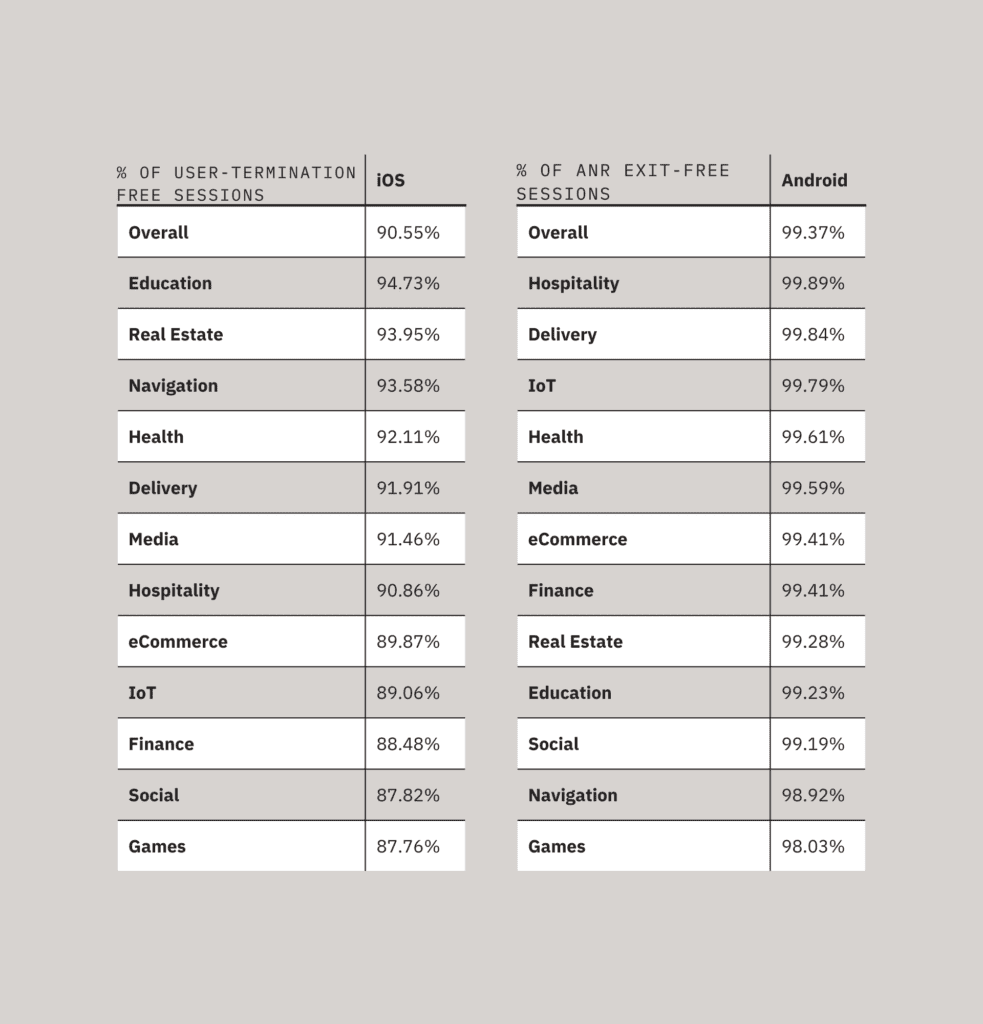
- Percentage of user-termination free sessions
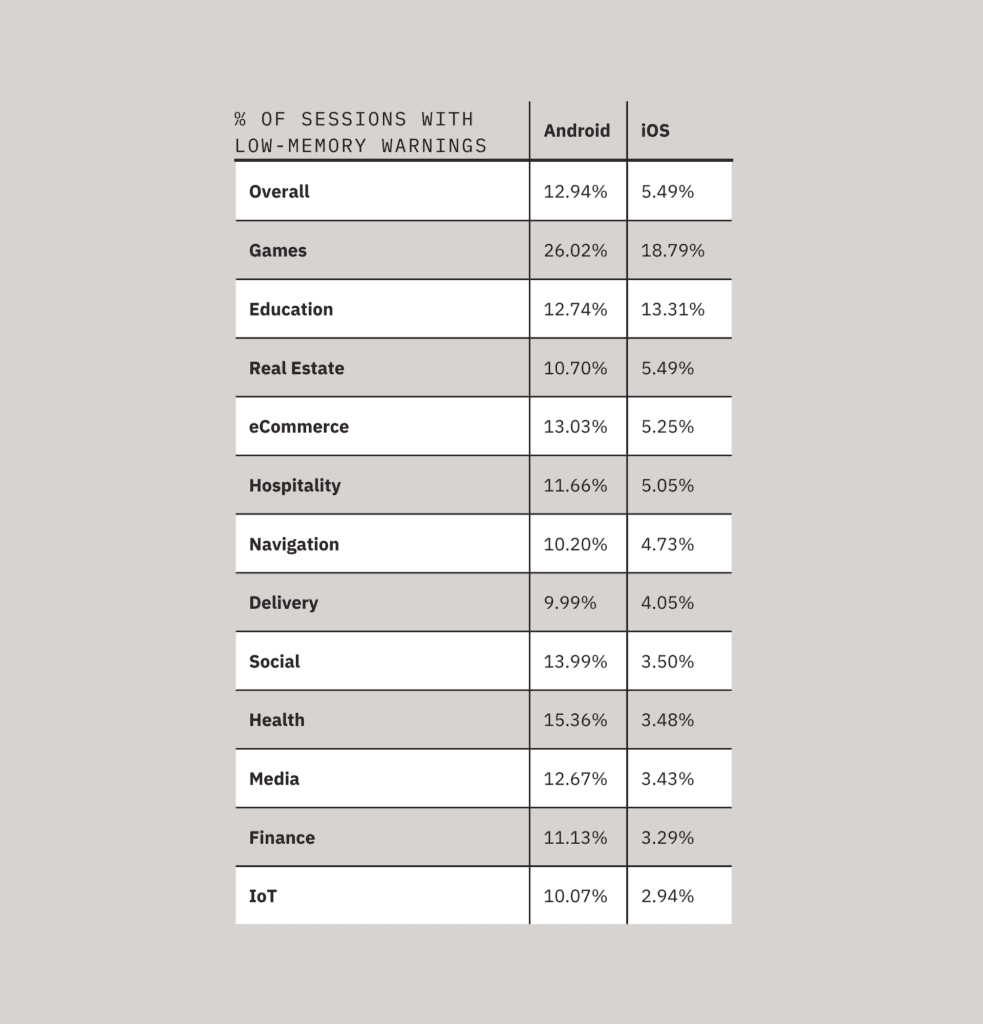
- Percentage of sessions with low-memory warnings
- Percentage of sessions that ended in ANRs
We took the median figure for these metrics across all the apps in each category and used it to build our ranking. Check out some of the key findings that emerged from this analysis:
1. iOS apps tend to outperform Android apps across indicators and across industries
When looking at performance metrics that are relevant for both operating systems, iOS apps rank consistently higher. iOS apps overall had a median crash-free rate of 99.93%, while Android apps were slightly lower at 99.81%. More dramatically, the median low-memory warning rate for Android apps (12.94%) was over twice that of iOS apps (5.49%).
Why such a difference? Well, much of it boils down to the sheer diversity of the Android ecosystem. According to Android’s own reports, there are at least 24,000 distinct Android devices out there, compared with only about 40 different models of iPhone that have ever existed (more than half of iPhone models are now discontinued).
Mobile engineers building apps for Android have to support an incredible diversity of device types, many of which are running different versions of the OS, have different screen sizes and resolutions, and may be relying on slower networks depending on local infrastructure. Additionally, Android’s open source platform, while one of its key strengths in making sure that “Android is for everyone,” can make it difficult to ensure consistency across all the programs and services compatible with the OS. All of these factors make it harder to maintain performance standards, and so we see Android apps ranking lower.
2. Mobile gaming apps struggle the most with performance issues
Across both Android and iOS, mobile gaming apps consistently rank at the bottom of the list for performance metrics. The most notable example is memory management. For iOS, 18.79% of gaming app sessions experienced low-memory warnings, compared to just 5.49% of sessions across all categories of iOS apps measured. Among Android games, the median low-memory session rate was 26.02% – relative to the Android average of 12.94%.
While dramatic, this finding validates what gamers and game designers alike know to be true: mobile games are incredibly memory intensive. Games are built from hundreds of different asset files, including textures, meshes, audio files, etc., that allow players to experience a true immersive quality. All of these files must occupy space on a device’s memory, and the knock-on effects of improper memory management can lead to even more severe issues, like user terminations, ANRs, or full-on crashes. We see all of the aforementioned issues reflected in our data on gaming apps.
3. Delivery apps perform the best
Across categories, delivery apps ranked as all-around best performers – with strong crash-free rates, ANR-free rates, and less low-memory warnings vs other industries. Considering how both extremely popular and extremely competitive these apps have become, their stellar ranking might come as no surprise.
It’s now estimated that about 40% of U.S. adults use food delivery apps. What’s more, the “delivery wars” are facing new challenges on top of a saturated market, such as competition from in-person dining, rising food and fuel costs, and a lack of customer loyalty. All of these make it harder for delivery apps to profitably operate, meaning that in this environment, optimizing mobile performance is not a nice to have – it’s a need to have to stay competitive.
As you can see from our data, there’s quite a bit of variability in how apps across industries perform. While this is influenced by the technical requirements of an app, it’s also shaped by the user expectations and business needs of a category.
For more info on our app performance benchmarking, plus insight into other key mobile industry trends, check out the full State of Mobile Experience 2023 report.

