WEBINAR on Aug 20: Getting started with OpenTelemetry and Embrace: Real user insights for mobile

Sign-up

VIDEO: A closer look at Embrace Performance Tracing for mobile apps

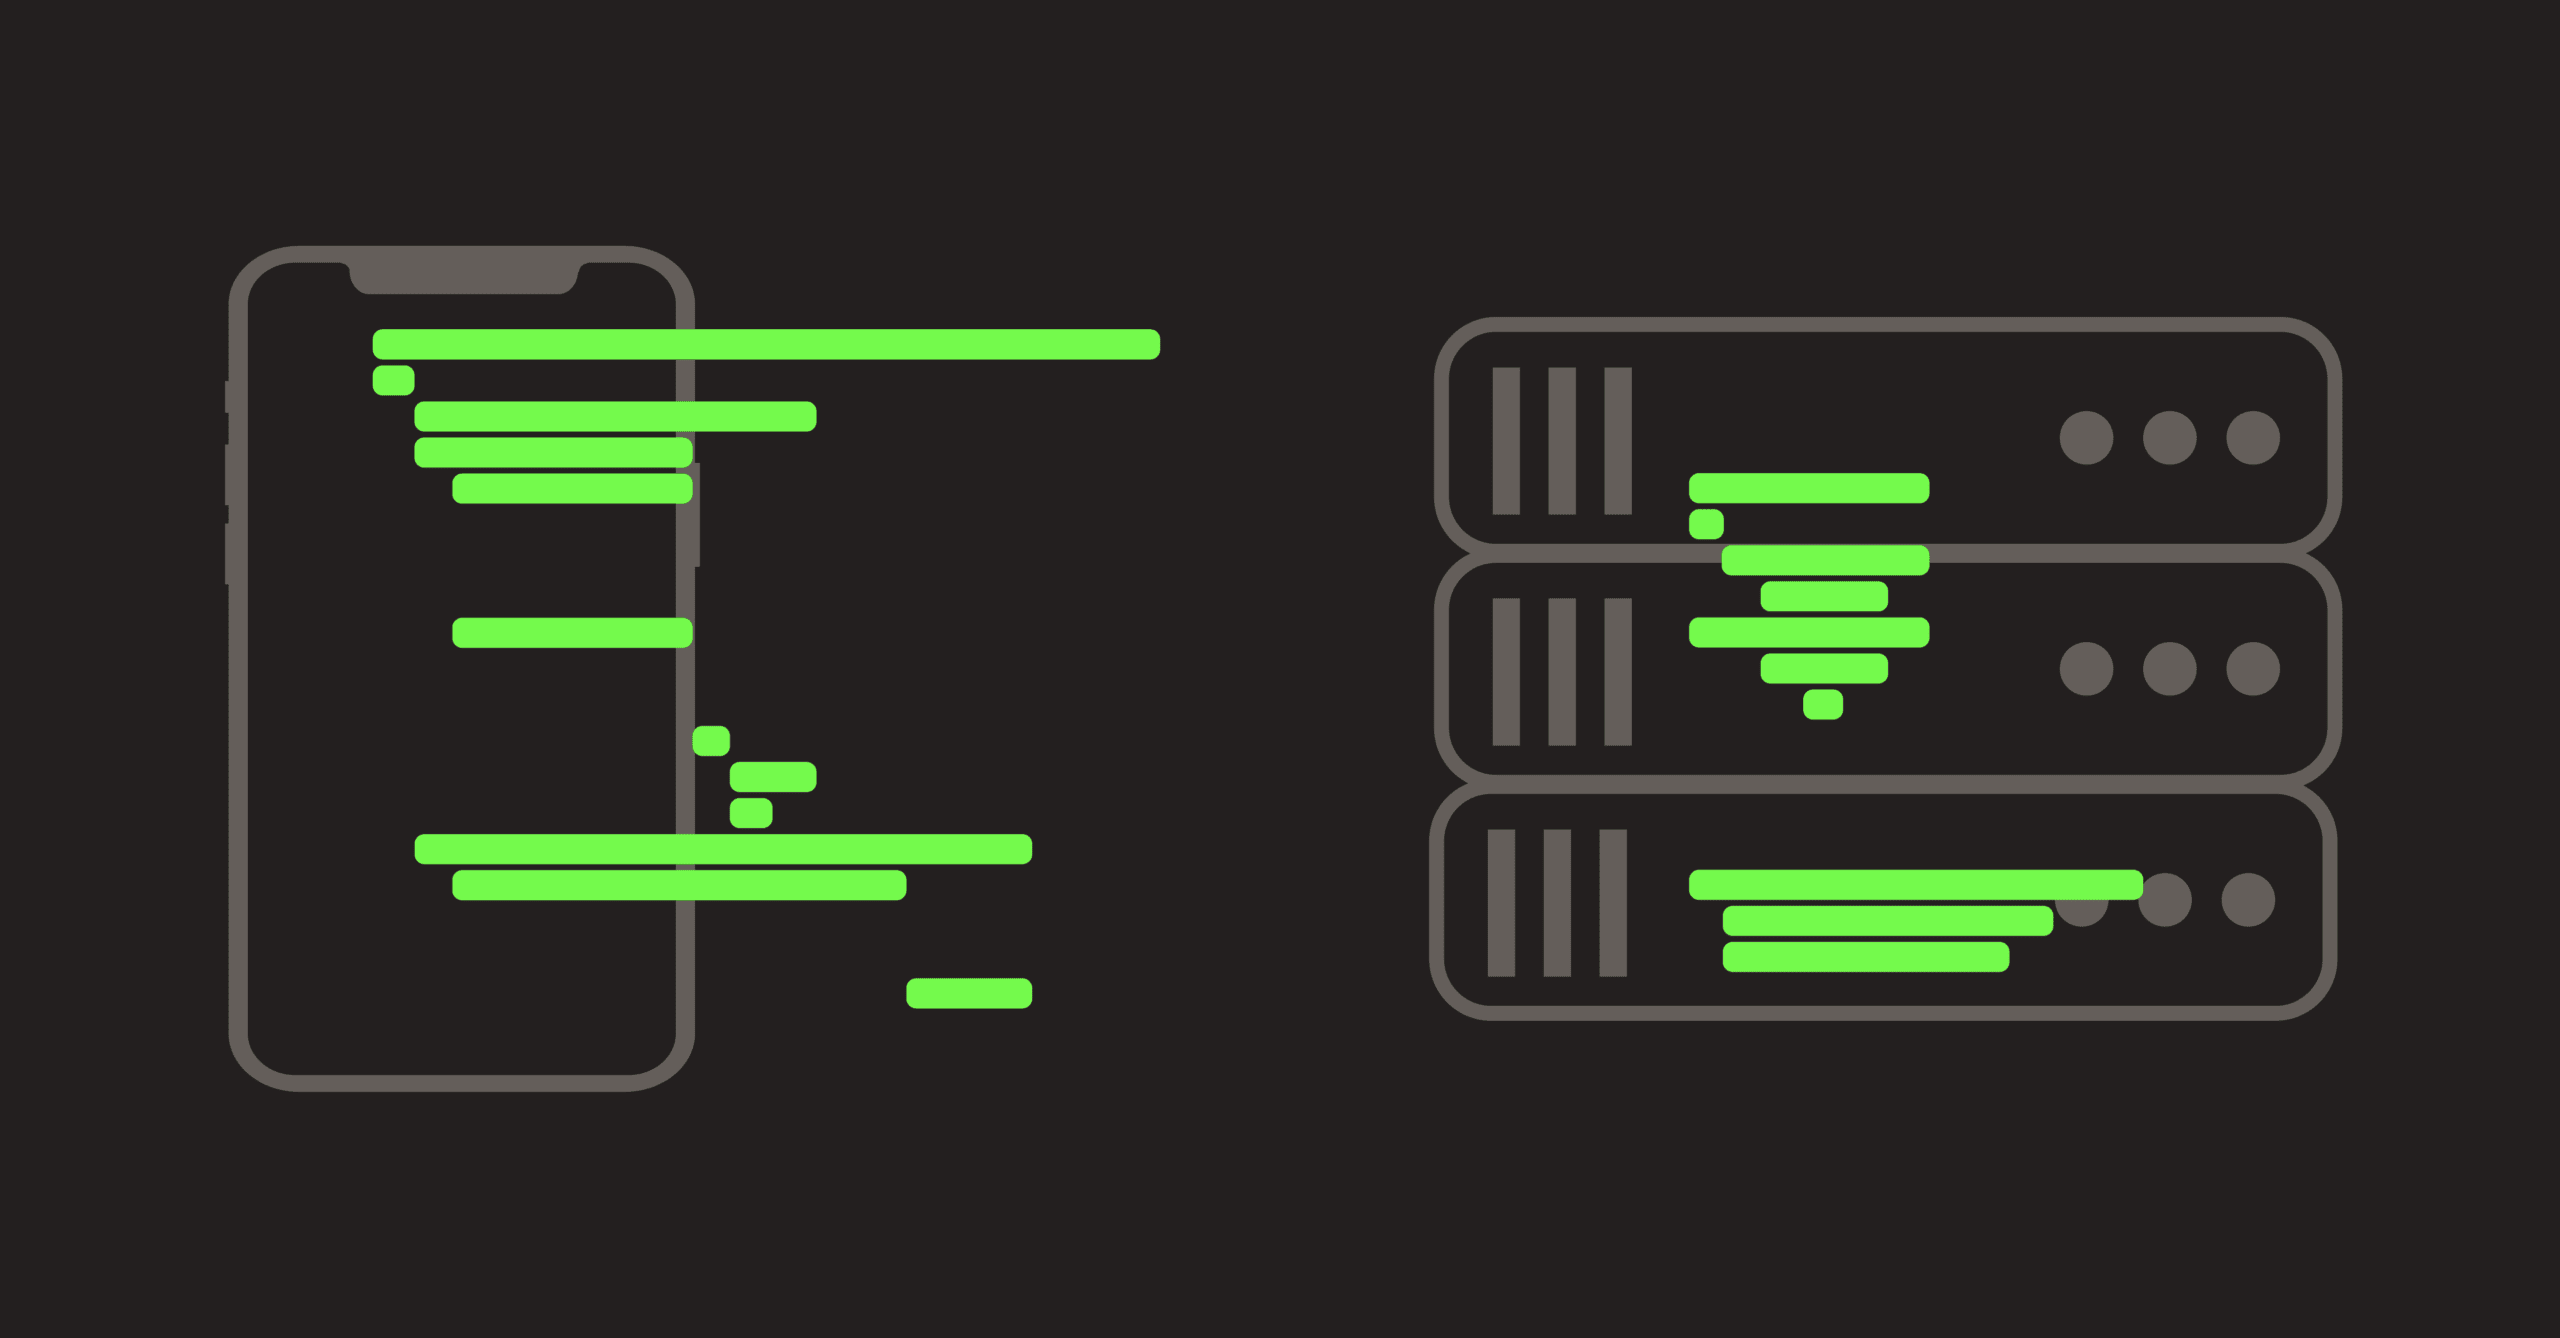
A group of graphics representing traces and spans as well as the metrics they can provide.

Embrace Performance Tracing gives mobile engineers the flexibility to monitor any operation within their app through the use of traces and spans.

In mobile app development, efficiency and performance are paramount.

To help engineers build better mobile experiences, we built Embrace Performance Tracing.

Performance Tracing allows mobile engineers to instrument and monitor key flows within their app with a huge level of detail and granularity, empowering them to truly optimize every element of their user experience.

Watch the short video below to learn more.

Embrace Embrace Performance Tracing

See Performance Tracing in action and learn how Embrace can help you build better mobile experiences by requesting a demo today.

Request a demo
Related Content

Auto-instrumentation now available for screen rendering

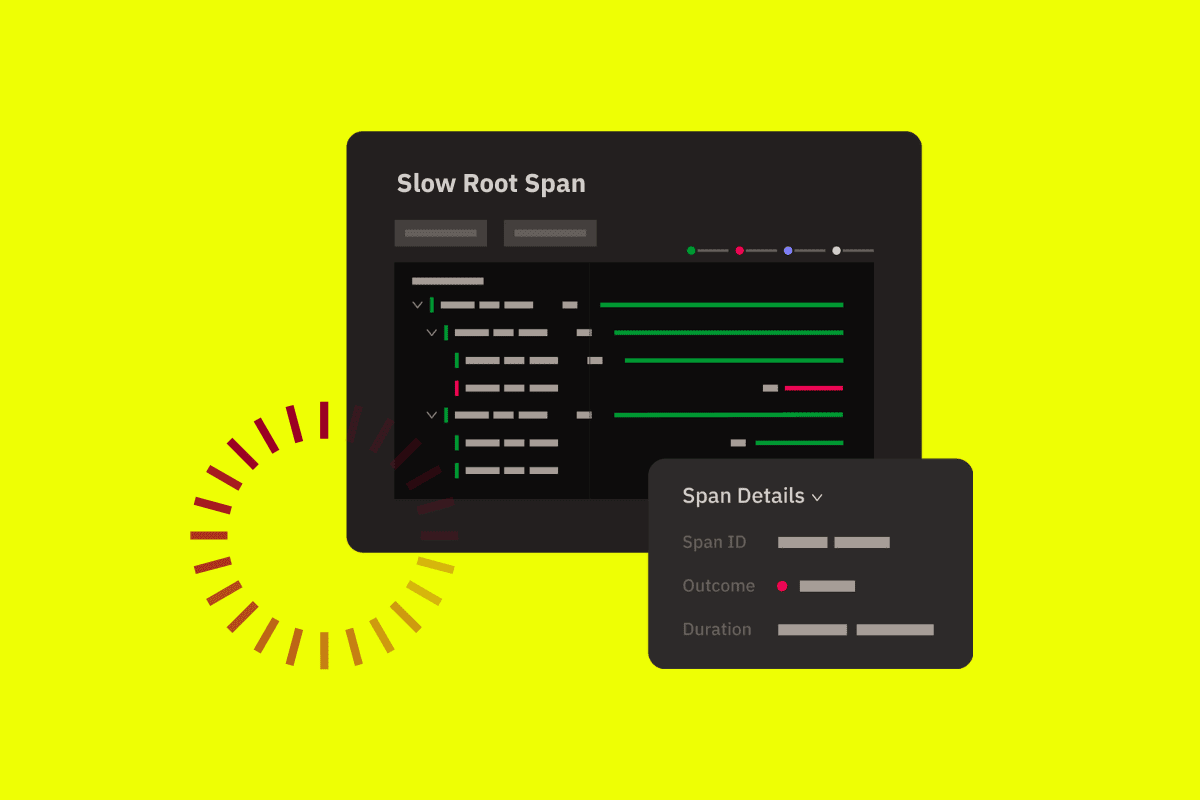
To understand how quickly end users can interact with your application screens, you can use spans and traces around key rendering events. Now, Embrace is making it easier than ever to do so by providing automatic instrumentation for screen rendering and interactivity, available for both Android and iOS.

Building a mobile SLO with Embrace and Grafana

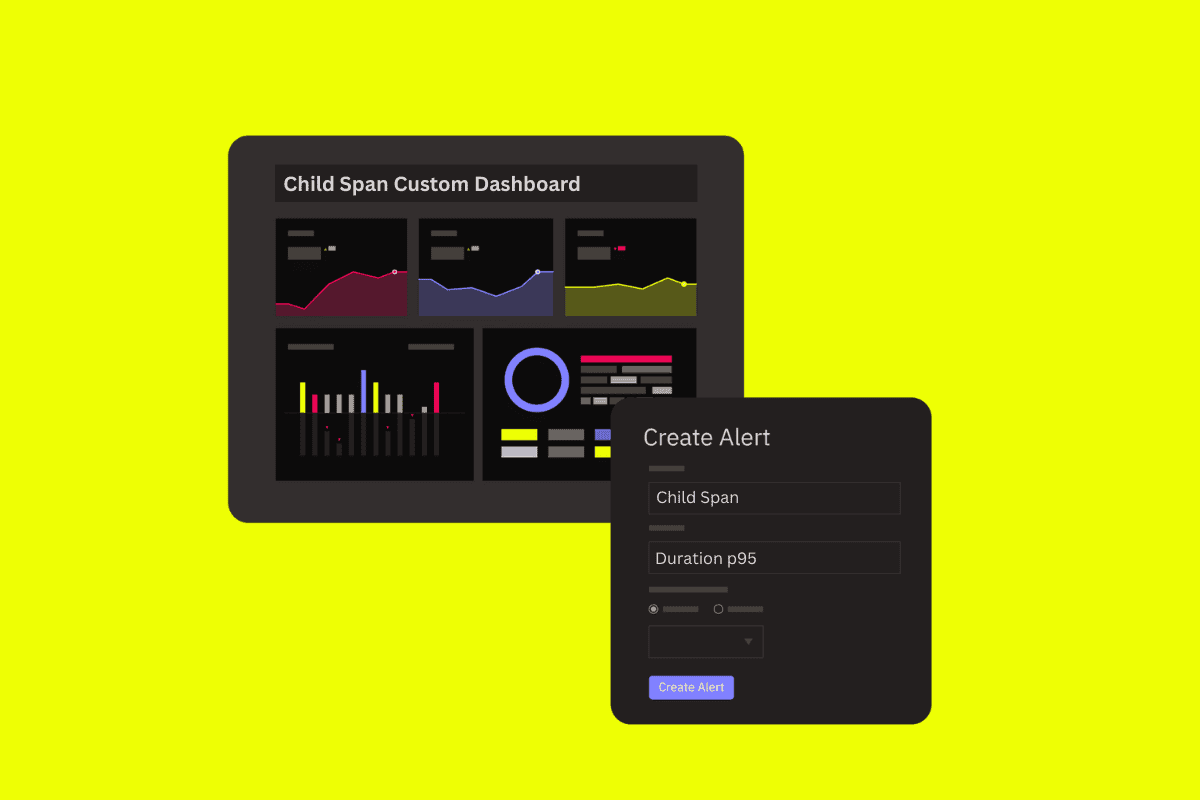
Engineering teams use mobile SLOs to monitor user flows and ensure user-impacting issues are detected and resolved quickly. In this tutorial, we'll show you how to use Embrace, in combination with Grafana, to build and monitor mobile SLO for your app – from initial app instrumentation, all the way to connecting to backend dashboards and alerts.
A stylized graphic of a smartphone with the wifi connectivity symbol

Analyze all network requests firing within a user flow via Embrace’s latest Performance Tracing update

Embrace's latest upgrade to our performance tracing feature lets engineers see all the network requests that occur in a user flow as individual spans within a larger trace instance. Engineers can now better understand the temporal relationship between network activity and other events within a flow, leading to quicker insights and faster issue resolution.