Embrace’s iOS and Android SDKs are now built on OpenTelemetry!

Read the release
App Performance

Unlocking the power of Performance Tracing with Embrace

Embrace's new Performance Tracing feature allows mobile engineers to instrument and monitor key flows within their app with a huge level of detail and granularity, empowering them to truly optimize every element of their end user experience.

Performance issues can be a silent killer for your app’s user engagement and retention. Slow load times, laggy user interfaces, and crashes are frustrating for users and often lead to negative reviews. But getting a full-spectrum view of your mobile application’s performance to resolve these types of problems is easier said than done.

At Embrace, our customers consistently tell us that gauging performance is a key part of their work to improve the end user experience. They want to measure fine-grained performance issues within a particular flow (such as app startup, particular rendering activities, or even multiple “chunks” of activity during a button click, view change, etc.).

Enter Embrace’s Performance Tracing: a solution that bridges this information gap, allowing you to monitor your mobile app’s performance without compromising on detail.

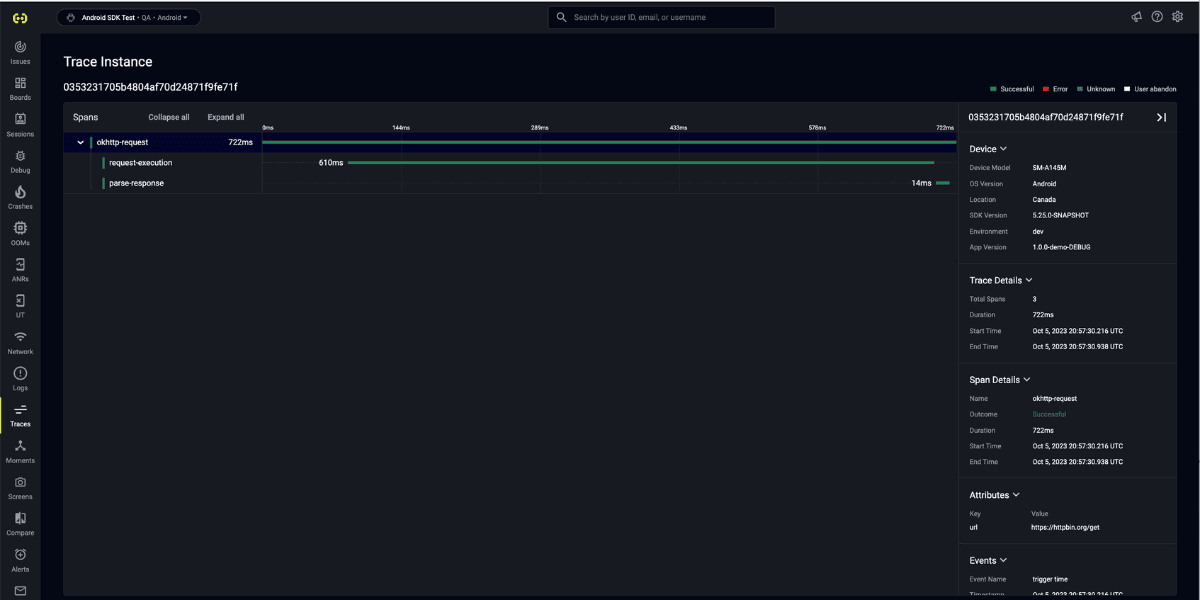
Our Performance Tracing feature enables you to monitor any of the key flows that matter to you via a system of spans and traces. You’re able to identify a critical flow and instrument customized spans around all the individual operations that make up that flow. Our SDK captures all the connected spans you instrument that, like a chain of events, link end-to-end to encompass a single trace of activity.

By seeing a flow in terms of both individualized operations, as well as an end-to-end singular occurrence, you can analyze its success or failure at whatever scale of detail you choose. Because it’s not just about gathering data; it’s about making sense of it to enhance your app’s performance and user experience.

The importance of performance tracing

There’s a few key reasons why performance tracing is so crucial for today’s modern mobile apps. First and foremost, it helps you identify bottlenecks in your application’s architecture, resulting in quick problem spotting and targeted optimization.

Performance tracing also enables you, as an engineer, to elevate the end user experience. A smooth, responsive app is more likely to retain users and lead to positive reviews. With this new feature, you’ll be able to make data-driven decisions to improve key user journeys.

Lastly, performance tracing simplifies debugging. By providing a detailed view of your app’s behavior, it makes it easier to pinpoint the root causes of issues. This is a huge time-saver, and it allows your team to focus on fixing the underlying issue.

Key features of Embrace Performance Tracing

All of these reasons motivated us to build our Performance Tracing feature, which we’re excited to announce is now in open beta.

Customers that enable Performance Tracing will be able to:

  • Create custom spans – Instrument, measure, and see aggregate metrics for any instrumented operation in your application.
  • Add custom attributes and events – Annotate spans and provide additional metadata for segmenting, debugging, and aggregating by adding your own custom attributes and events.
  • Gain more granular visibility into app performance – With parent/child relationships you can track sub-workflows within your app, measure success rates for specific user actions, and distinguish different types of failures (e.g., UI failures, API failures).
  • Reduce performance impact – Spans data is sent atomically with the session payload, removing the performance impact of making network calls to transmit performance timing metrics.
  • Remove data limits – Limits on data collection that exist today with other performance timer solutions are practically eliminated. At launch we will support up to 100 traces (each with 10 spans) per session, plus 50 attributes and 10 events for each span.
  • Use it within the OpenTelemetry framework – We adhere to OpenTelemetry semantic conventions whenever possible to enable frictionless export of spans data.

How to get started

Getting started with Embrace’s Performance Tracing is straightforward:

  • Ensure you’re using a supported version of the Embrace SDK. Performance Tracing is currently available on our iOS and Android platforms and is coming soon for Unity, Flutter, and React Native.
    • iOS Embrace SDK version 5.23.1 and above
    • Android Embrace SDK version 5.24.0 and above.
  • Define a span name around the operation you’d like to track.
  • Call the APIs to start tracking and another to stop tracking when the operation is complete.

Detailed documentation with code snippets is available for iOS and Android and is coming soon for Unity, Flutter, and React Native.

More to come

Performance tracing is essential for any mobile app looking to provide an exceptional user experience. Embrace’s real-time, user-centric approach gives you the tools you need to identify, prioritize, and resolve performance issues effectively.

This open beta is just the start, in the future you can expect:

  • Out of the box performance tracing for key workflows – In future releases, Embrace will provide out-of-the-box spans for common key workflows like app startup.
  • Trace forwarding – Connect Embrace’s client-side performance tracing with your backend observability tool of choice for full end-to-end coverage.
  • Advanced querying – Improved grouping, filtering, and querying capabilities to allow you to create custom workflows for key experiences in your app.

Embrace Performance Tracing is available for all Pro / Enterprise level customers at no additional cost.

Ready to take your app’s performance to the next level? Request a demo to learn more about how Embrace can help you build amazing mobile experiences for your end users – again and again.

Embrace Deliver incredible mobile experiences with Embrace.

Get started today with 1 million free user sessions.

Get started free

Build better mobile apps with Embrace

Find out how Embrace helps engineers identify, prioritize, and resolve app issues with ease.