Mobile application crashes happen when an app unexpectedly stops or exits due to an unhandled exception, resulting in a negative user experience. These fatal errors can be triggered by hundreds of factors, such as issues in the native code, resource limitations, bugs in frameworks/libraries, network problems, and more, which can slow down the resolution process.
Existing crash reporting tools today are mostly ineffective in accurately surfacing critical crashes and determining their root causes. These tools provide limited context and incomplete stack traces that are often sampled and not in real-time, offering only a partial view of crash logs, stack traces, and other diagnostic information. A lack of comprehensive data makes it challenging for engineers to accurately reproduce, diagnose, and proactively fix crashes.
Embrace offers a different approach, purpose-built for mobile engineers. Our intelligent Crash Reporting solution, available on iOS, Android, Flutter, Unity and React Native, collects high-fidelity, unsampled crash data from your apps to drive accuracy in your troubleshooting. With better data, engineers can quickly identify high-priority crashes, precisely reproduce the error and efficiently pinpoint the root cause for resolution.
In this post, we’ll discuss how you can use Embrace to:
- Accurately detect app crashes with superior data capture
- Surface high-priority crashes with intelligent crash grouping, automated root cause analysis (RCA) and proactive alerting
- Get to the root cause of crashes faster with a complete play-by-play of the user’s activity that led to the crash
- Gain end-to-end visibility of your mobile crash data with APIs, integrations and tagging
Accurately detect app crashes with superior data capture
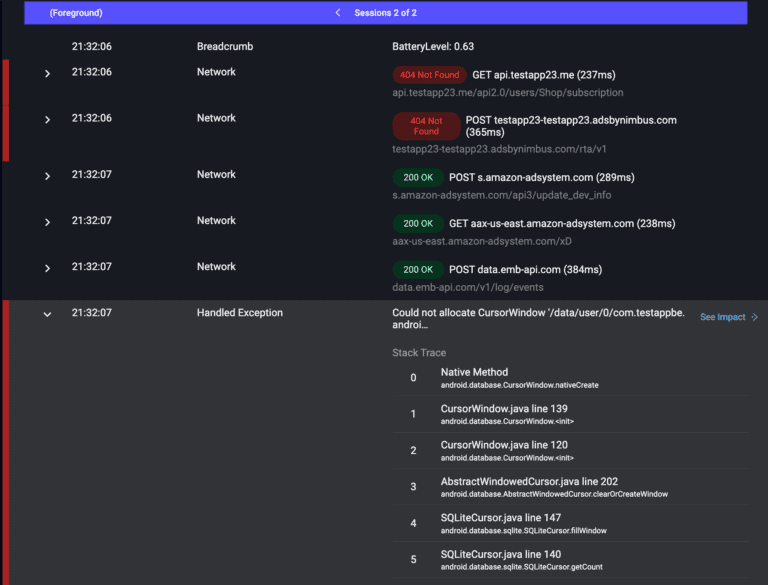
Embrace automatically captures essential crash data and helps you make sense of it. We capture crash logs, stack traces, metadata and every user interaction (including taps, clicks, web views, push notification data, etc) completely out-of-the-box. This comprehensive data is collected across foreground and background user sessions for all of your apps. Additionally, Embrace goes beyond capturing unhandled exceptions by also auto-collecting data for handled exceptions. This means you can analyze both fatal and non-fatal errors across your entire user base, with no more manual stitching together of log and crash data.
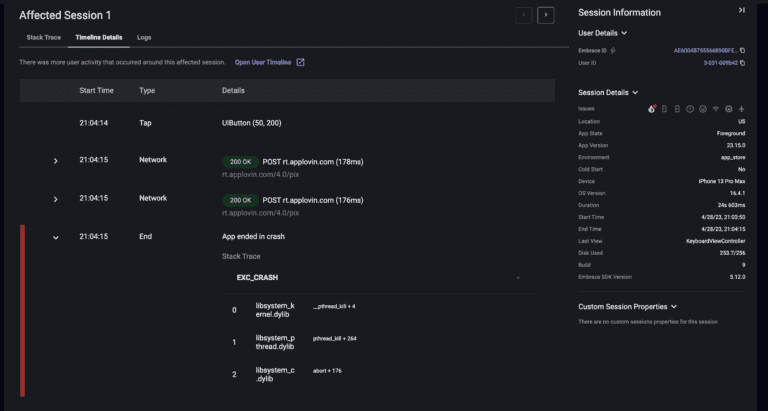
When it comes to unhandled exceptions, Embrace captures the relevant exception details after the crash occurs. We then automatically stitch related user sessions together to give you every detail the user experienced before, during and after the crash. This level of detail empowers engineers to accurately determine root cause and fix issues quickly.
Surface high-priority crashes with intelligent crash grouping, automated root cause analysis (RCA) and proactive alerting
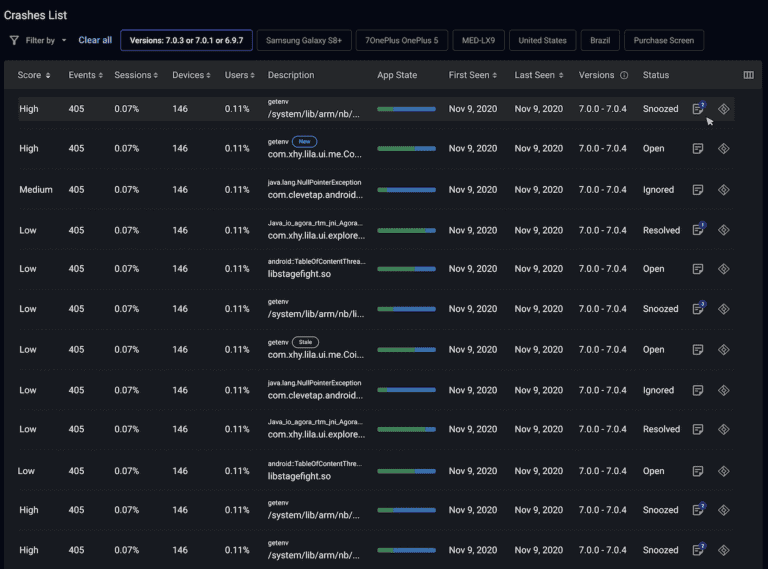
When dealing with crashes, it’s common to see a list of 20-30 different functions and stack traces that could potentially be the root cause. However, inaccurate grouping of these stack traces can be hard to prioritize and lead to a lot of noise and wasted time. With our solution, we help you intelligently surface high-priority crashes with advanced groupings based on the most relevant stack frame assessed across multiple exceptions to help you know which crashes to focus on first. This ensures that you can identify and address the most impactful crashes affecting users.
But groupings by relevant stack frames may not be enough so we take it a step further. We use Crash Correlations (in beta) to understand what’s distinctive about each crash group. This feature uses machine learning to automate the grouping of similar crashes, allowing you to understand the distinctive characteristics of each crash group and correlate that with device attributes, versions, locations, users, architectures, models, and advanced segments like network requests. You can easily spot statistically significant insights without the need for manual investigation. For example, you can automatically analyze if a crash group is due to an architectural bug specific to certain iPhone models (such as iPhone arm 64 and arm 64e) or due to something else entirely to speed up investigation.
In addition to improved grouping, Embrace provides Crash Scoring (in beta), which takes into account variables such as time, impact, device, and operating system. This scoring system helps you surface critical crashes that are relevant to the specific segments you care about. By considering these variables, you can focus on resolving crashes that have the most significant impact on your target audience.
Spot critical crashes with proactive alerting and crash overview
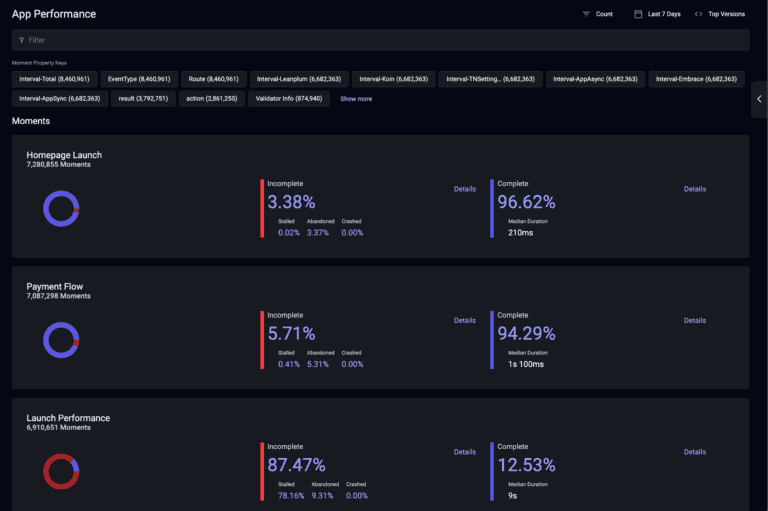
Embrace continuously analyzes millions of data points across your applications to help you proactively spot critical crashes before your users do. Our real-time alerting can help you separate important crashes from the noise with context rich alerting that identifies spikes and drops for critical crash indicators. You can set up alerts for important user flows, like payment flows, add to cart or during paid advertisements to optimize user experiences for revenue-generating moments.
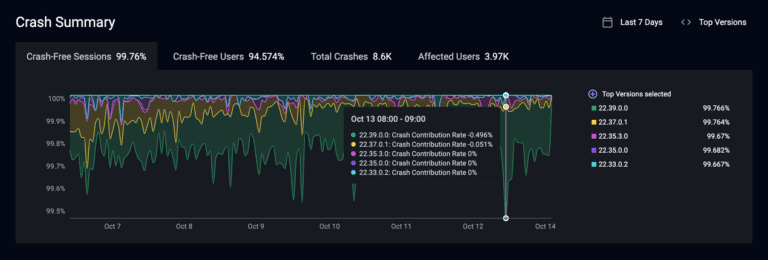
With Crash Summary, teams get an out-of-the-box overview of critical crash metrics like crash-free sessions, crash-free users, total crashes, user impact and more in a single view. You can surface patterns and anomalies by version and deployment across their user base.
Get to the root cause of crashes faster with complete out-of-the-box user session context
In most cases, problematic code may not be the sole cause for fatal errors. Mobile is complex and there may be changing environments, user interactions or device vitals that all contribute to the application crash. Contextual insights that are not downsampled, like network calls, clicks, battery level, OS version, push notification delivery etc, are all important to understand what could be contributing to the crash.
Embrace gives you the ability to easily pivot from a high priority crash group directly into an affected crash user session to help you understand every detail that led to the crash in more depth. With User Session Insights, Embrace collects all foreground and background user and device activity leading up to the crash, completely out-of-the-box, so engineers can quickly and accurately reproduce the crash and understand how other factors may be contributing to it without wasting time cobbling together log, event, stale crash and product analytics data. If you find that low connectivity, heavy view rendering and bad code all contributed to the crash you can quickly share session details with the right teams using out-of-the-box Jira and Slack integrations to speed up resolution.
You can also search and find the User ID for a specific crash session or you can zoom out to see the impact to the entire user base on specific errors, crashes, failing network calls, etc. Embrace takes a non-sampling approach to user sessions to deliver an accurate representation of the user base and experiences when assessing user impact.
Tag and send crash data to the best person to solve them
Whether you’re working with a multi-team development setup or relying on 3rd-party vendors, getting your issue in front of the right engineer is often half the battle. With Embrace Crash Tagging (in beta) you have the power to build a rules-based attribution system that automatically assigns crash resolution to code owners or 3rd party Ad Vendors. By capturing and enriching data with the SDK or owner’s name during the build process, crash tagging makes it simple to associate specific owners with the crash frames for swift resolution. This enables engineers to efficiently sift through tagged crashes, guaranteeing that the appropriate on-call team or 3rd party SDK partner has access to all the necessary information to resolve issues fast.
Integrate mobile crash data into your existing workflows for true end-to-end visibility
It’s your data, make sure you put it to work. We give you the freedom to share your crash metrics without vendor lock-in. During critical business events, like Black Friday or significant product launches, end-to-end visibility of crashes is critical for fast troubleshooting and communication across teams.
- With Embrace Metric’s Forwarding, teams can automatically sync crash metrics to Datadog, New Relic, and soon Grafana Cloud.
- You can also tap our Metrics API to flexibly pull stats into whatever data stack works for your teams across DevOps, Product, Marketing etc.
- Teams can also quickly visualize data with out-of-the-box Marketplace integrations with Grafana, Datadog and more to come.
Never solve the same crash twice
Consistent app crashes can result in dissatisfied users, wasted engineering time and ultimately may lead to user churn. We’re dedicated to simplifying the process for mobile engineers to identify and address crashes proactively. By providing superior crash data capture, intelligent crash grouping, and a complete play-by-play of the user journey, we empower mobile engineers to efficiently resolve crashes and allocate more time towards creating exceptional app experiences.
Start auto-capturing advanced crash insights today with your first 1 million sessions completely free.

