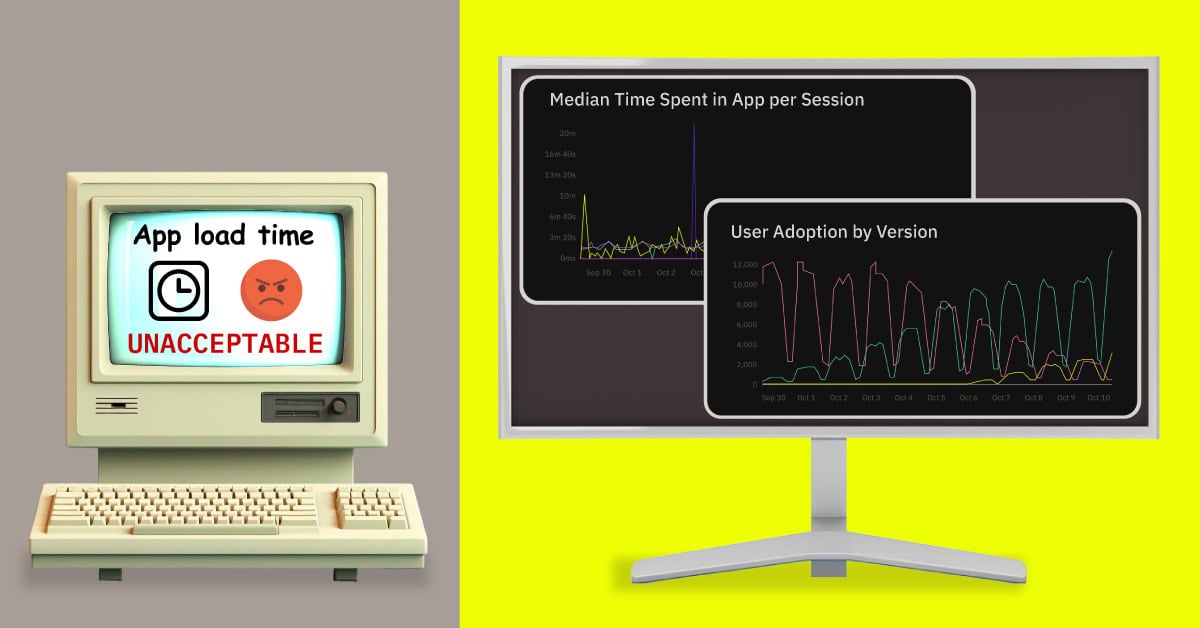
Join us Thursday, Sept 26th for the "What your SLOs aren’t telling you about Mobile" webinar

Save your seat!
metrics

See the big picture with Embrace Custom Metrics

Embrace captures all the data from all the sessions of an app. Your Error Logs, successful and failing Network Requests, and screen tap locations are all recorded by the mobile app client. That’s a lot of data. Too much data to be constantly monitoring.

To provide a big-picture view, developers can aggregate data into summary metrics. These Custom Metrics empower teams to measure any dimension that’s important for the performance of your app.

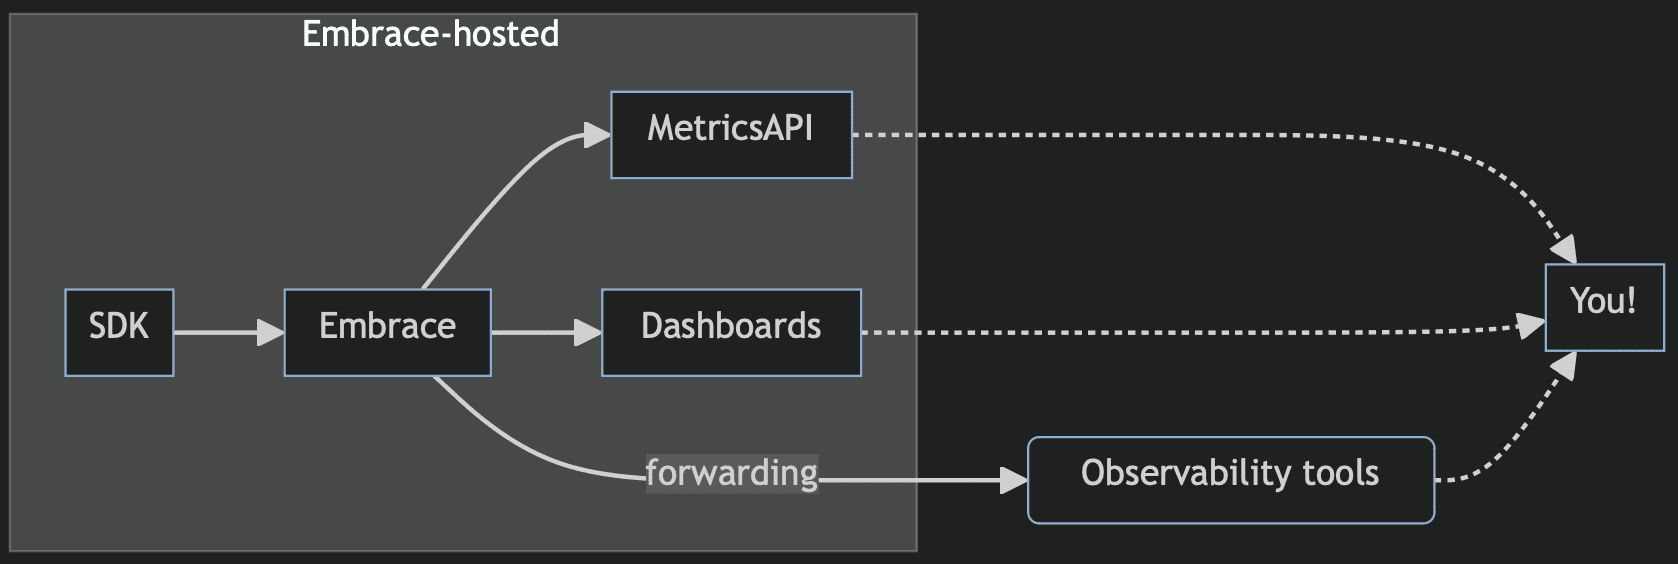
Metrics can be configured to sync with external observability stacks, or accessed directly via our Metrics API. Whether you intend to create alerts in PagerDuty, report up on SLOs in your Honeycomb instance, or monitor version adoption in your “Single Pane of Glass” on Grafana, you can use Embrace’s Custom Metrics to pull insight out of raw data.

A standard set of metrics covers most use cases, such as app version, OS version, and device model. These can be sufficient for high-level app monitoring. However, Custom Metrics can be built off a wider variety of dimensions matching broad or hyper-specific performance needs.

For example, crashes can be filtered for the latest version, then broken out by the Owner tag associated with it. Similarly, network requests can be filtered to specific endpoints by domain and path, and refined further using a duration cutoff. Sessions themselves can even be split out using your custom-defined properties, such as user authentication status or users who experienced an ANR.

(See our docs for a full list of supported dimensions)

Any Custom Metric that you create can be used outside of Embrace via a number of integrations. All Custom Metrics are available directly in our Metrics API, and can be queried on-demand using a PromQL query. Embrace Metrics can be set to calculate over three time-windows: daily, hourly, or every five minutes.

Additionally, if you use such observability vendors as Grafana Cloud, Honeycomb, or Chronosphere, Embrace can directly forward metrics into those tools for further analysis using our Data Destinations product. Note that each observability platform has different pricing structures for ingesting these metrics, so you should consult their pricing guidance before getting too ambitious with your metrics forwarding!

To create a Custom Metric is straightforward; it can be done either via our API or directly in the dashboard. Our documentation has a complete set of dimensions for using the Custom Metrics API to create, delete, and list Custom Metrics. In the dashboard, visit Settings > Custom Metrics, and click “Add Custom Metric.” You can use Embrace’s fields to select your base Metric, add any filters and group-bys, and name the Custom Metric. You’ll see a graph preview for the data before selecting where you will be forwarding it, if anywhere:

Once created, the metric will begin recording and be held in our Metrics API for 15 months. Metrics are created shortly after the time window closes, and do not change. This means that late-arriving data will occasionally not be included in the Metric’s calculation, so results might look lower than up-to-date data in our dashboard.

Embrace can also forward data to a number of observability tools for integration to a single pane of glass. We term these tools, and our product for getting them to the tools, our Data Destinations.

Similarly to the Metrics API, metrics in Data Destinations can be measured every 5-minutes, hour, or day. These metrics are sent via the OpenTelemetry standard for metrics and can be queried as metrics using each tool’s query language (for example, NRQL in New Relic, or PromQL in Grafana).

Costs vary by observability tool, though most metrics are sent with low cardinality. Tagging a metric by app version, OS version, or device model usually results in unique combinations in the order of hundreds, and, for example, Grafana Cloud’s free tier doesn’t start charging until you have thousands of metrics.

With Custom Metrics, you can add a layer of aggregation onto high-resolution observability data from your apps. This lets you define performance for your mobile app, and monitor it using the tools you already use.

We can’t wait to see what Custom Metrics you come up with! If you have any questions or feedback, join our Slack Community.

Embrace Deliver incredible mobile experiences with Embrace.

Get started today with 1 million free user sessions.

Get started free

Build better mobile apps with Embrace

Find out how Embrace helps engineers identify, prioritize, and resolve app issues with ease.