As mobile increasingly becomes a primary revenue mechanism for companies, mobile teams require complete visibility into user experiences. That way, they can make decisions across the entire business, including engineering, product, marketing, BI, and more. Instead of jumping between different tools, your teams need and want to have a holistic approach to improving data sharing and reliability – a single source of data that serves every business need.
With Embrace, your teams can create custom real-time dashboards for the metrics and segments they care about. In this post, we’ll cover many ways that mobile teams can answer key business questions in order to grow revenue, retention, and engagement.
What metrics do different teams at your company care about?
Every company has different goals and KPIs. Even when competing against mobile apps that offer similar functionality (e.g. ride share, dating, e-commerce), the current priorities for the companies determine where to focus their attention. An early stage company can be focused on releasing features as quickly as possible to accelerate adoption whereas a mature company can be focused on optimizing performance as a competitive advantage.
We’ll now go over some high-level metrics that different teams can monitor with Embrace. While this list is by no means exhaustive, it illustrates many of the benefits that a comprehensive mobile platform can provide to your entire organization.
Product teams
Product teams want to track engagement, build more robust funnels to boost ROI, use insights to inform redesigns or UX changes, and make informed decisions about how often people are using new in-app features. They can use Embrace to answer key business questions like the following:
- Which new features are gaining adoption?
- Where are users spending the most time within the app?
- Are users getting frustrated in certain areas, leading to force quits?
- Are certain features causing crashes or OOMs?
- Where are features not delivering on expected outcomes?
For several of the above questions, product teams want to know what the user experience is for the features they own. Beyond crashes or other errors, they want visibility into where features are delivering a poor user experience.
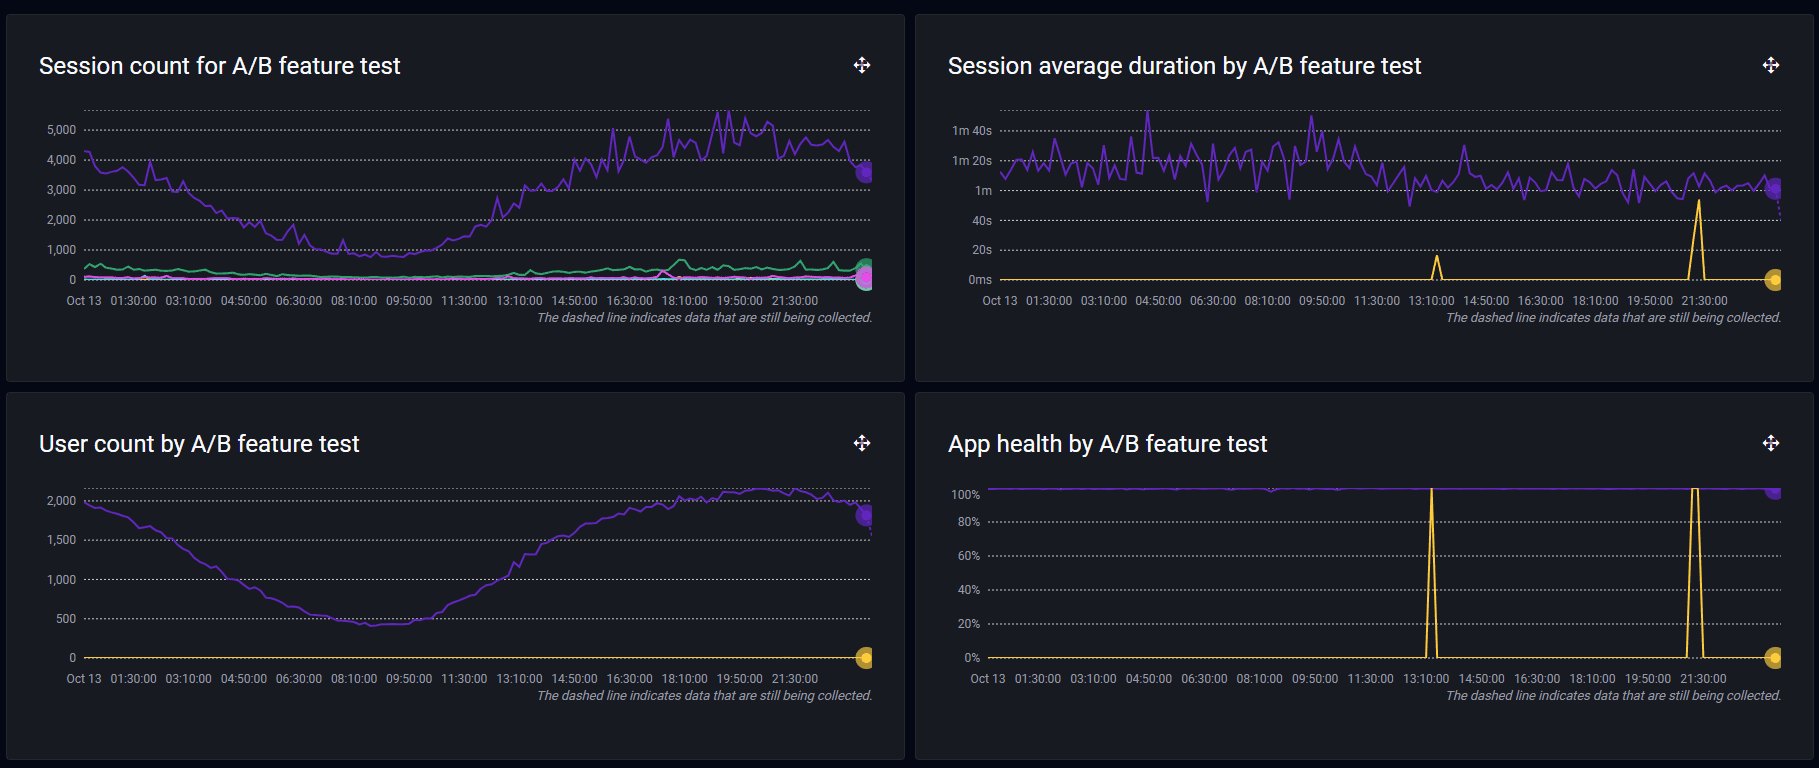
The following image shows health, adoption, and engagement metrics when A/B testing a new feature.
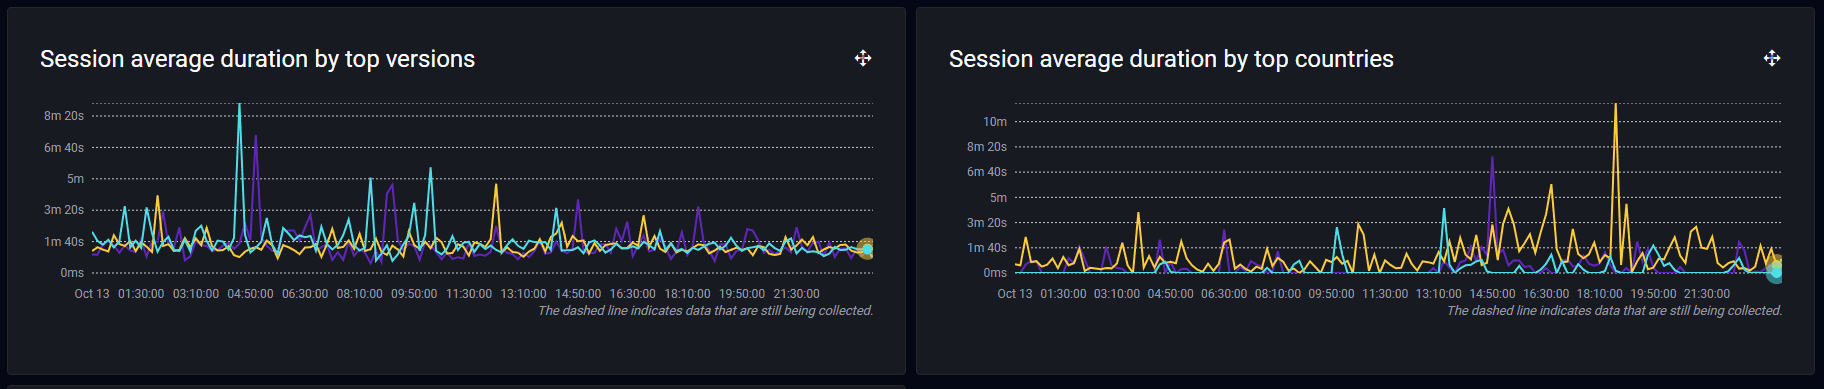
In addition, product teams can track how long users are spending within the app for different versions, features, regions, etc.
Monetization teams
Monetization teams want to track ad vendors to see where these third-party SDKs are impacting performance and failing to load ads.
The following image shows a custom widget dashboard that tracks crashes caused by ad vendors, providing teams with visibility into where revenue leaks might be occurring.
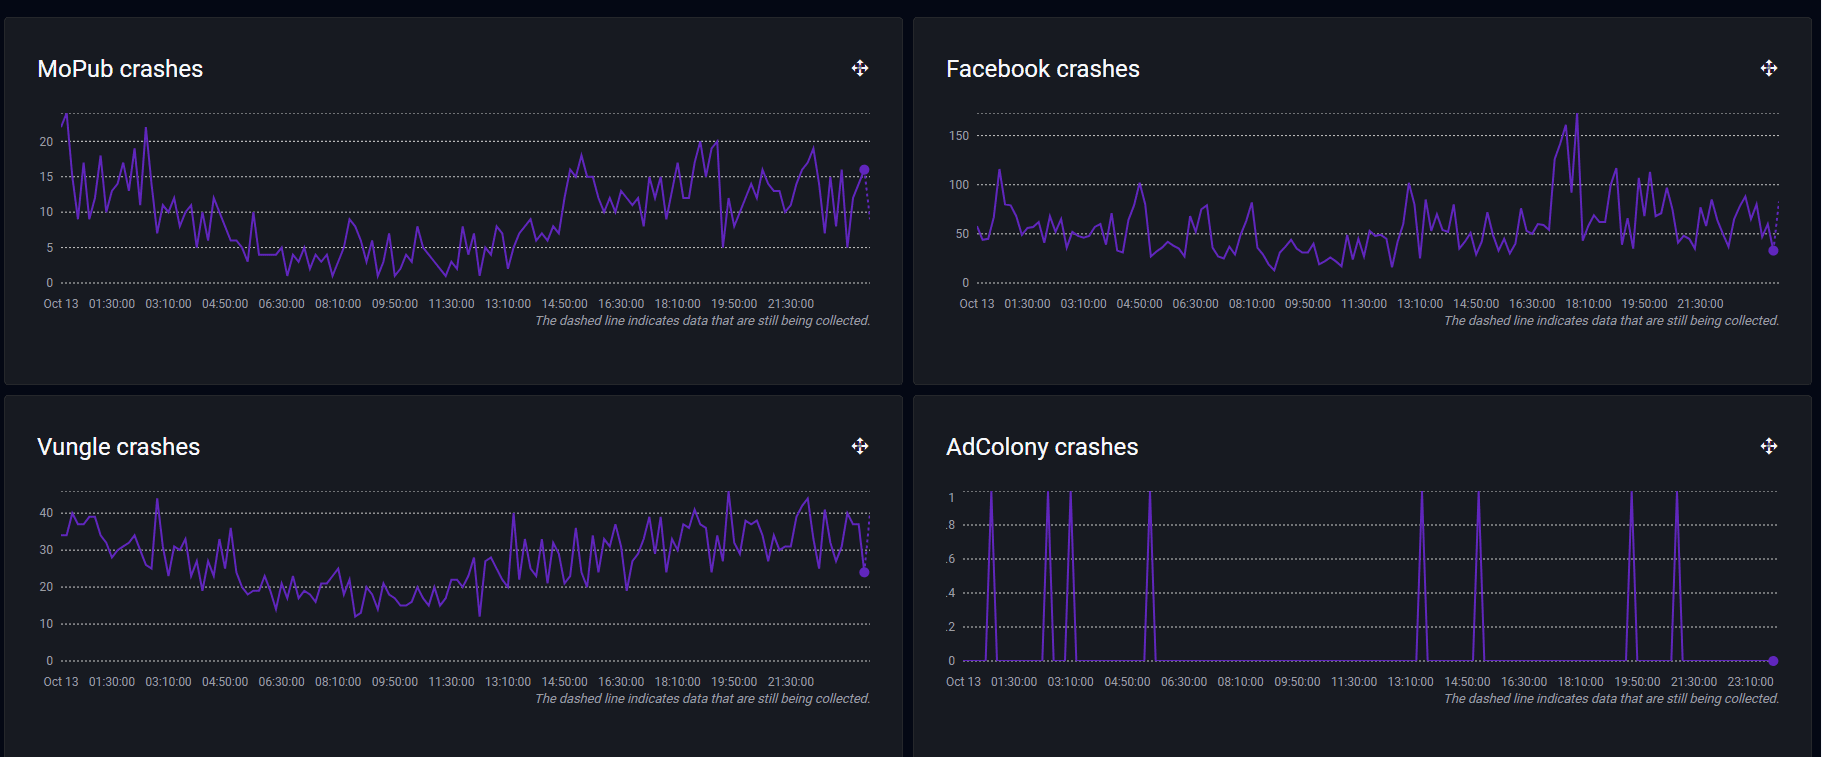
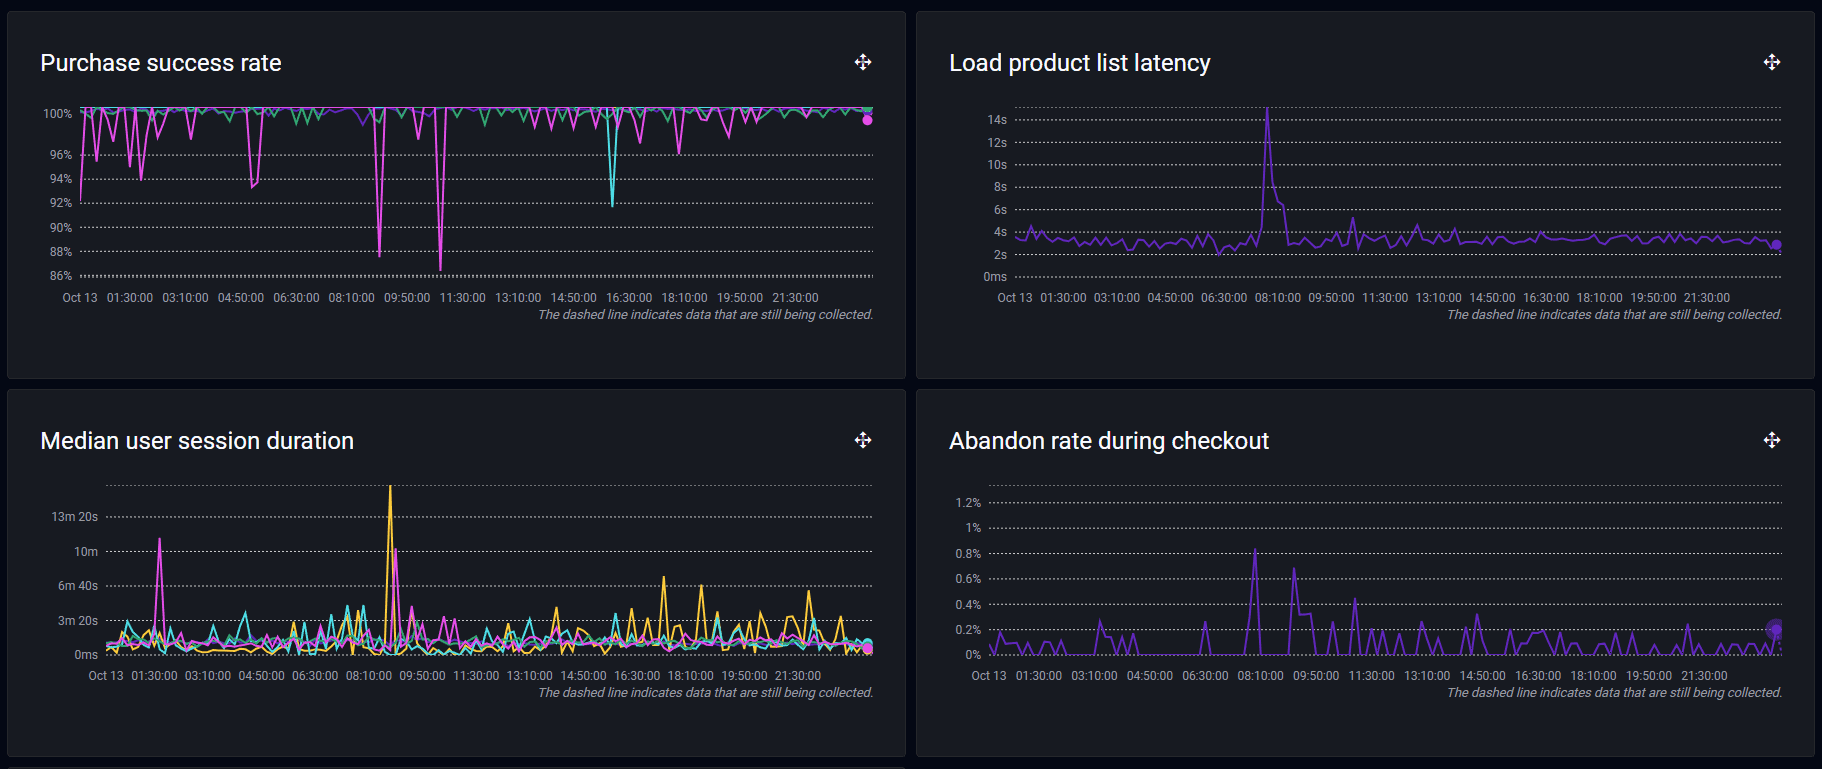
In addition, monetization teams want to quickly spot purchase failures and whether they are associated with a particular payment type like ApplePay, Visa, or PayPal. With Embrace, you can also track how long purchases are taking to complete. Combined with our moments feature, teams can understand exactly where users are abandoning frustrating purchase flows.
Engineering teams
Engineering teams care about stability and performance issues, including:
- Where the app is crashing or experiencing errors
- Where the app is running slower (e.g. startup, login, add to cart, purchase)
- Where users are getting frustrated (e.g. difficult smart device integrations with IoT companion apps, buggy purchase slows with POS systems)
- Where the app is freezing and leading to ANRs
With Embrace, engineering teams can use real-time dashboards to answer questions like:
- Where are users struggling to integrate with IoT devices?
- Why are users dropping out of key funnels like making a purchase or booking a hotel room?
- Which app versions are experiencing the most crashes or OOMs?
- Is startup time getting slower in newer releases?
Furthermore, they want to know if there are regressions and, if there are, what they need to do and how they will put a stop to them, which real-time dashboards can help them to answer.
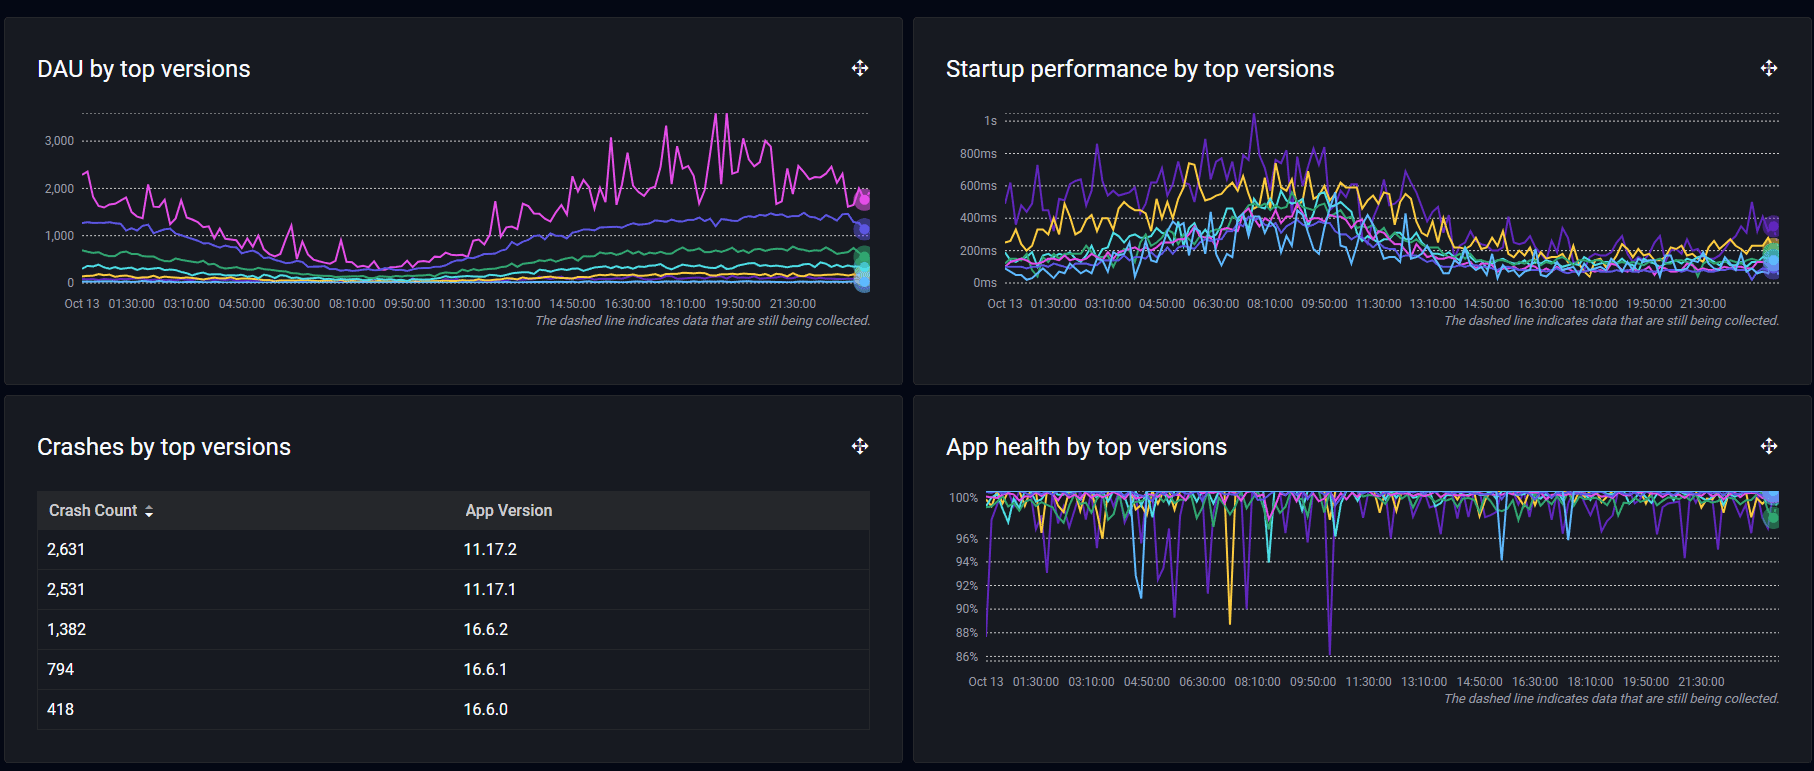
The following image highlights how engineering teams can easily track performance and stability metrics across versions, including ANRs, error logs, low memory warnings, OOMs, and crashes. By easily comparing metrics as new versions are released, teams can immediately spot regressions worth investigating.
Business Intelligence teams
Business Intelligence teams want to find trends and patterns to answer key business questions, including:
- Which user segments are the most valuable to the company?
- Are users in different countries having vastly different app experiences?
- Where should the company invest to drive better revenue and retention?
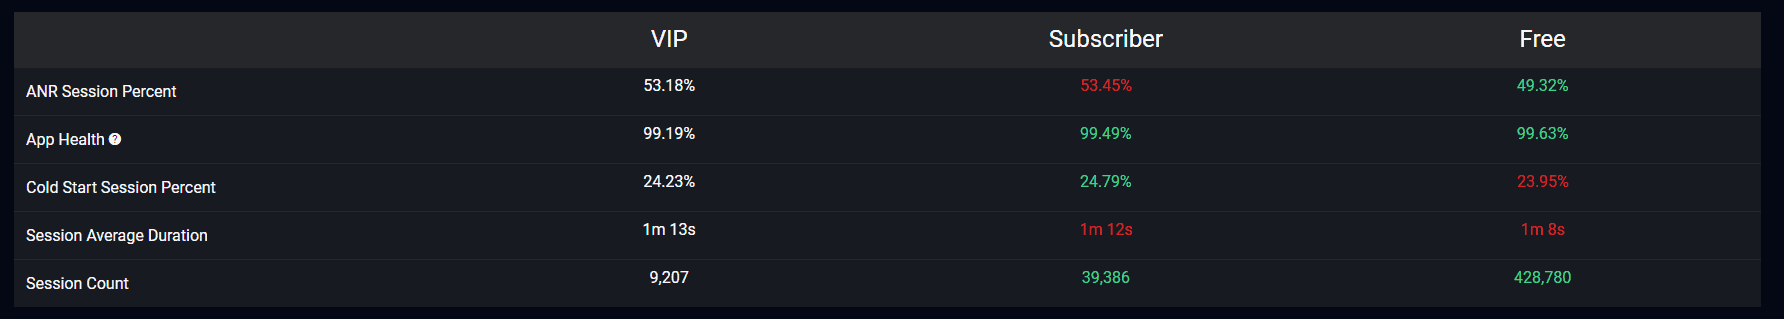
With Embrace, these teams can track metrics across specific user segments. In the following image, we’re comparing health, adoption, and engagement metrics across our different user types.
Many companies want to carefully control how they launch mobile apps in new regions. Differences in devices, connectivity, data plans, user preferences, and more can greatly affect success when entering a new market.
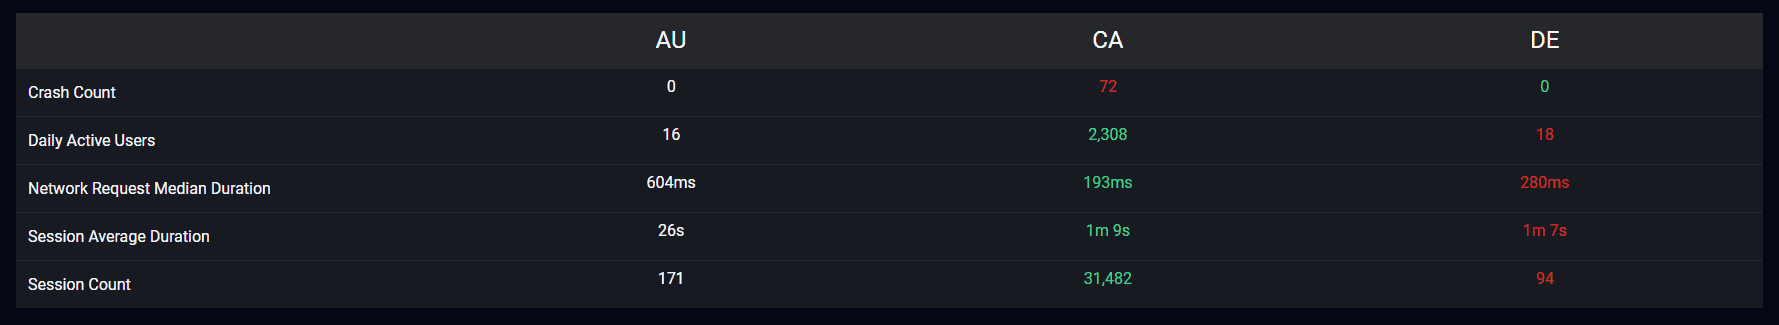
In the following image, we are monitoring key metrics across countries to ensure we are delivering a consistent app experience.
Marketing teams
Marketing teams can use Embrace’s real-time dashboards for many reasons, including:
- Tracking adoption metrics across promotions
- Optimizing user acquisition spend based on which new users stick around
- Abandoning underperforming promotions early
These teams want to know which avenues are more successful in attracting and retaining users so they can continue to invest in winning strategies. After all, if push notifications are driving way more purchases than emails, the company can focus on them.
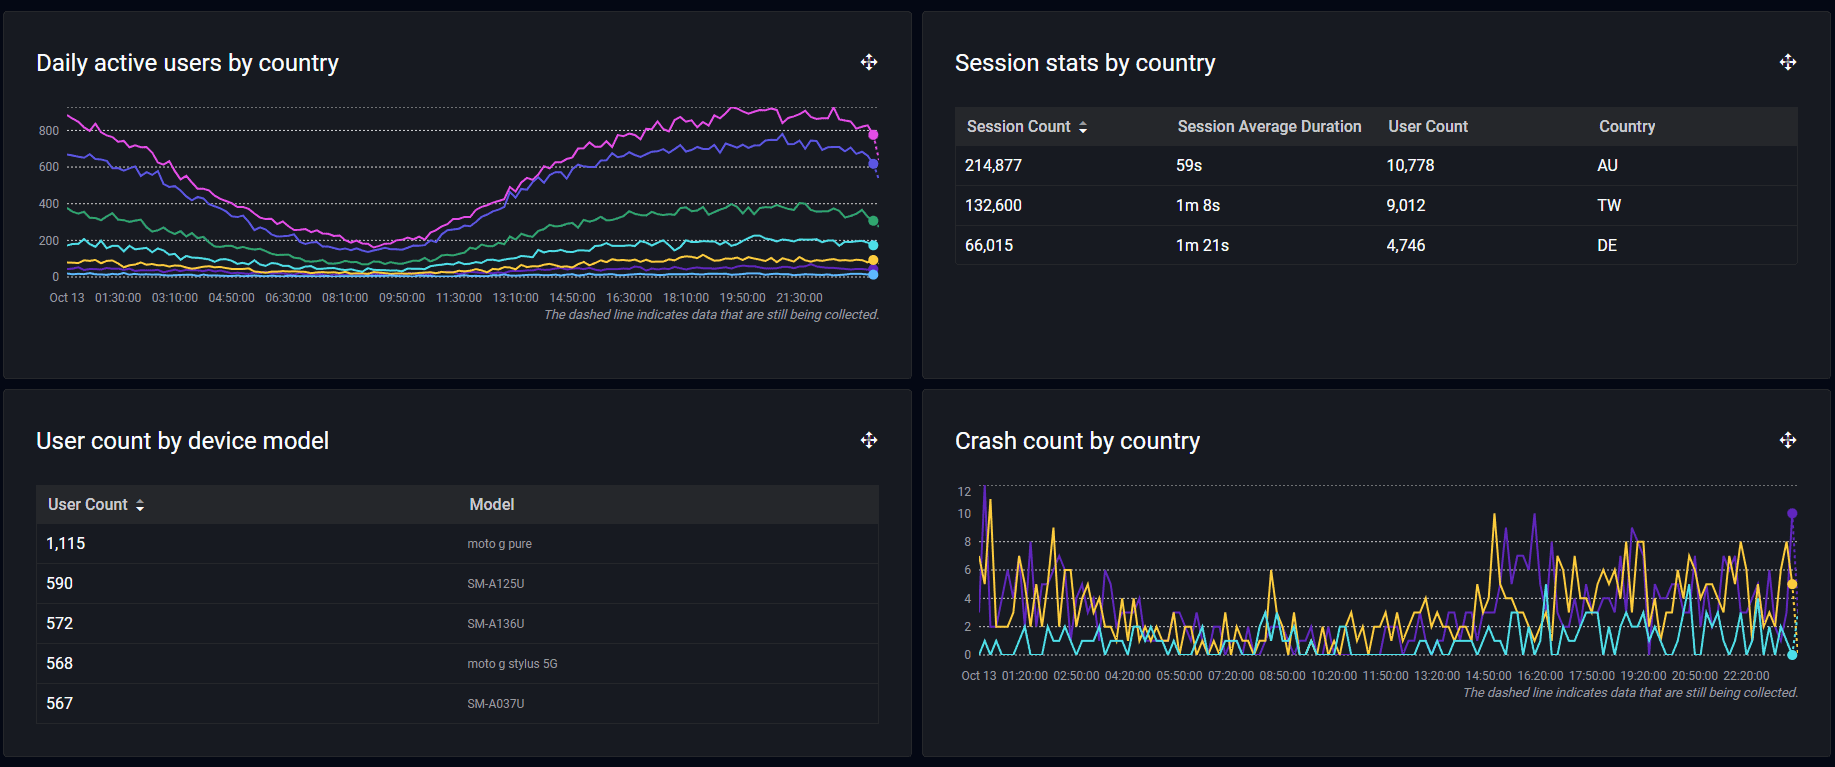
The following image highlights how the marketing team can track adoption and first session engagement stats by device and country. When launching in new regions, the team wants to know where they’re seeing initial traction.
Now that we have discussed different ways that teams can utilize Embrace’s real-time dashboards, we will move forward to discussing which dashboards to use in different instances.
How Embrace provides real-time visibility into the metrics you care about with custom dashboards
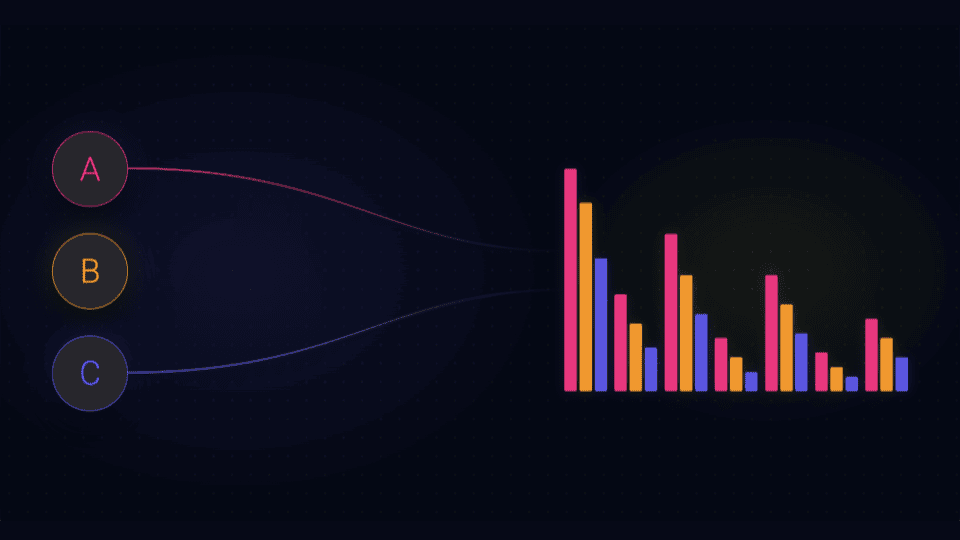
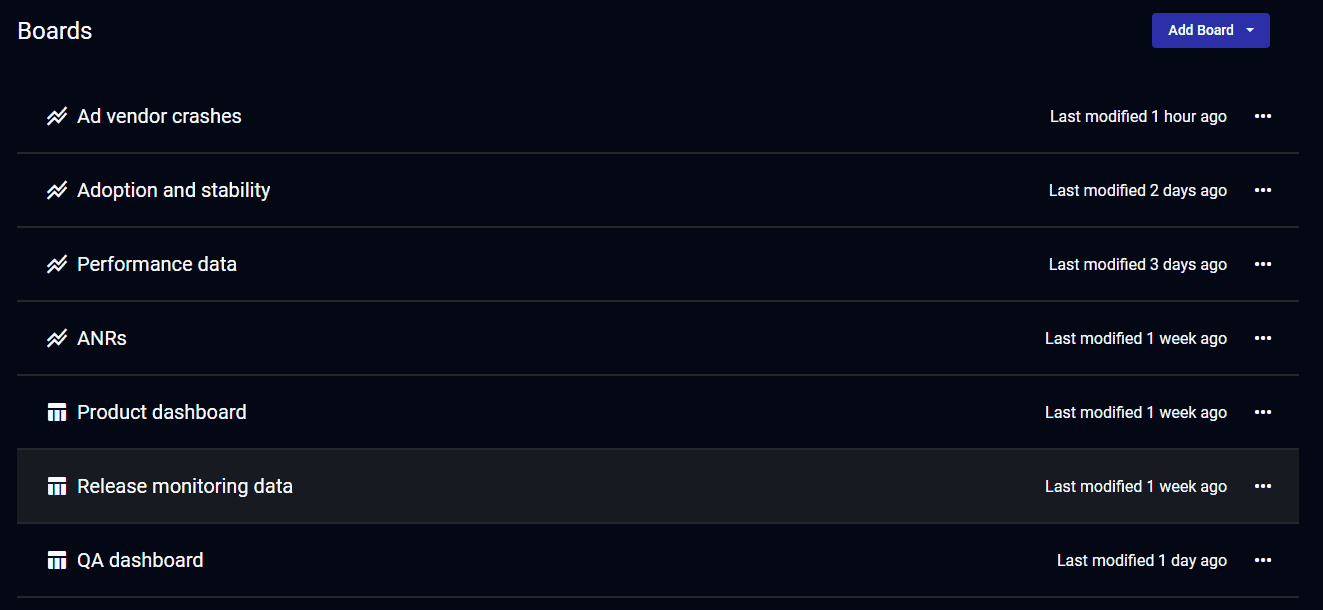
Embrace provides two ways of creating dashboards so teams can easily track the metrics they care about. Since every team and company is different, you have full control over how you monitor your mobile apps. The below image demonstrates an organization-wide way of creating dashboards for specific teams.
Let’s next dive into the different types of dashboards that Embrace provides.
Widget dashboards
Widgets are individual tables or graphs that track one or more metrics. Here are a few examples of the types of things you can monitor with a widget:
- A graph of crash counts over time, broken out by app version
- A graph of moment median duration (e.g., startup) over time
- A table of the count of error logs, broken out by OS version
- A graph of median session duration over time, broken out by country
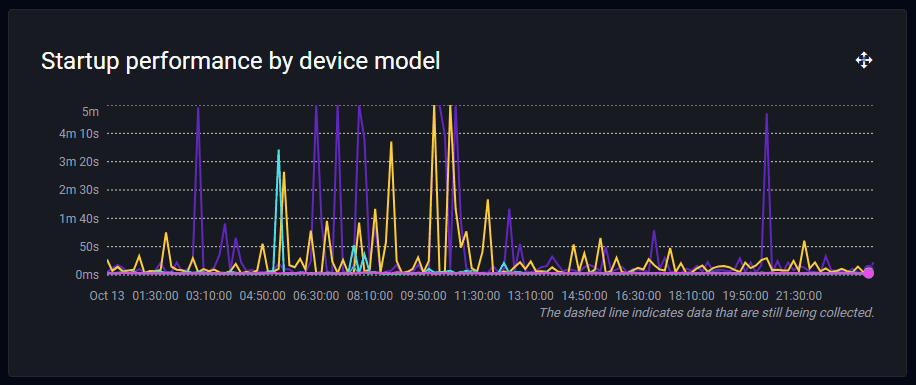
Below is an image of a widget that shows startup performance by specific phone model.
With Embrace, you can use starter widget creators to simplify making common widget types, including:
- Crashes – to track crash counts over time
- Logging – to monitor error, info, and warning logs
- App Performance – to track the performance of key user moments
- Sessions – to track usage, adoption, and engagement metrics
- Networking – to monitor network requests over time
Comparison dashboards
The second kind of dashboard that Embrace provides are comparison dashboards, which are meant for comparing a group of metrics across specific datasets (e.g. user segments, countries, experiments). For example, instead of looking at crash stats for all app versions, you might want to break out crash stats by OS or device. You can monitor a number of different segments across your apps, ranging from:
- App version
- Build
- Country
- Environment
- Model
- OS version
- Persona
- Session Property Key
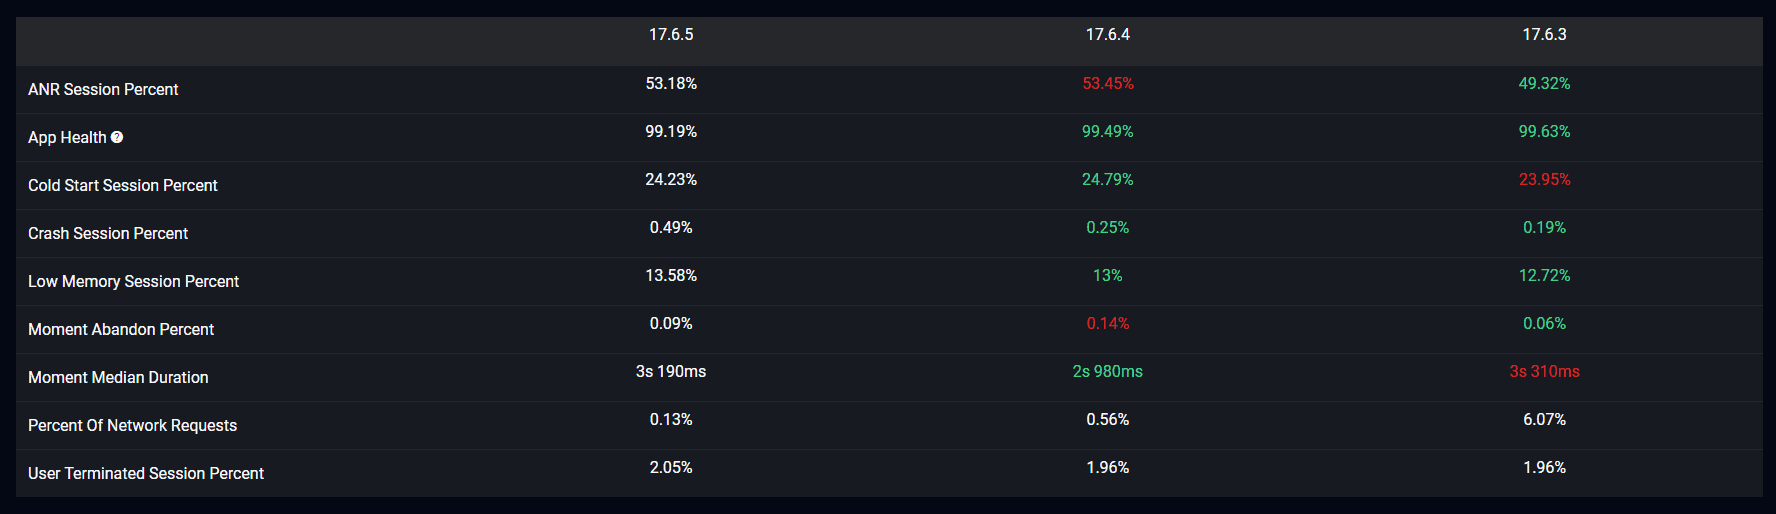
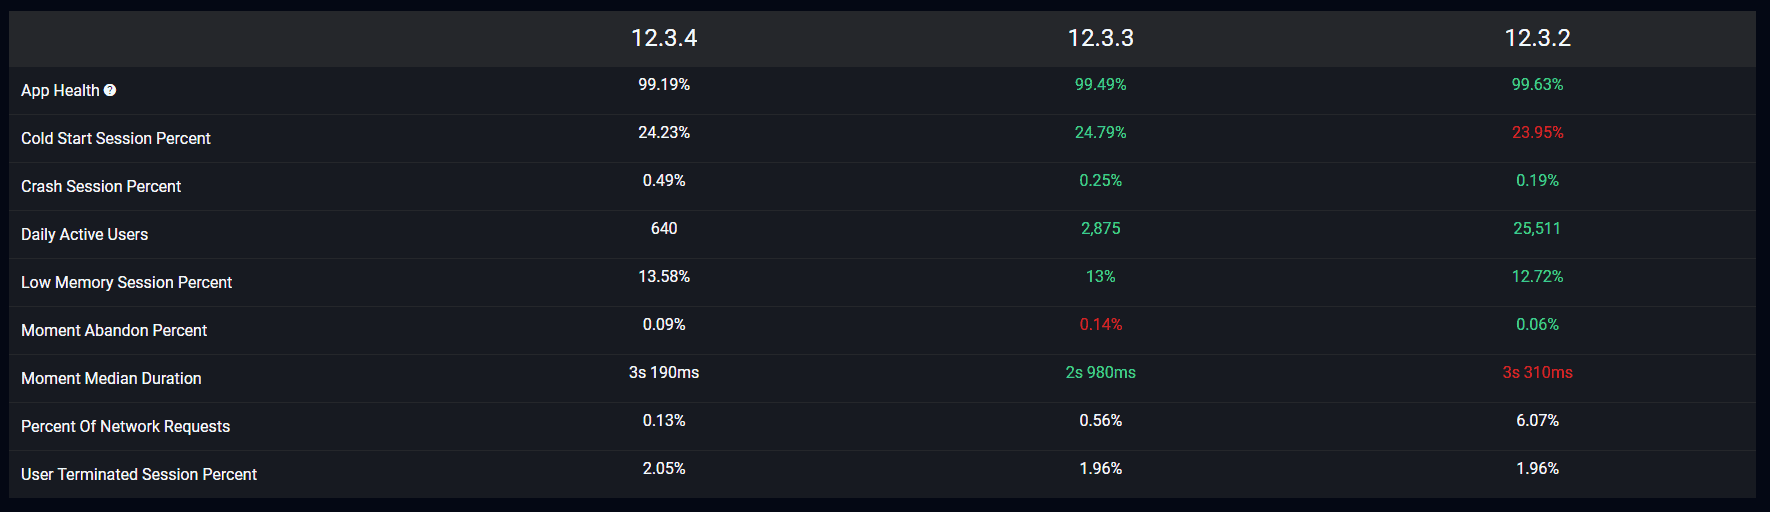
Below is an image of a comparison dashboard comparing several health metrics across different app versions.
You can further refine your data to focus on what you care about using filters. For example, if you want to know how your network requests perform on the latest OS versions, you can filter the data to only include those versions.
Embrace supports a wide variety of metrics covering crashes, logs, network requests, ANRs, cold starts, app health, and user terminations, to name just a few. If you want to monitor it, Embrace can do it.
Final thoughts
With Embrace’s custom dashboards, your mobile teams can improve app performance and answer critical business questions with a single data source. Mobile teams can create completely customizable real-time dashboards to monitor the metrics and segments they care about, empowering them to easily optimize their mobile app. The end result is more engaging user experiences that drive better business outcomes!
If you’d like to see how complete mobile visibility can revolutionize how you deliver incredible mobile experiences, get started with a free trial today.