WEBINAR: Coming soon to a browser near you: OpenTelemetry! Experts share how the OTel community is building better browser observability.

Register here

Exploring User Journeys: a walkthrough of our latest user-focused observability feature

Engineering teams have more tools than ever to monitor errors, crashes, and Core Web Vitals—but connecting that data to real user behavior and business impact remains a challenge. What should teams actually prioritize? Which frontend issues meaningfully disrupt user engagement?

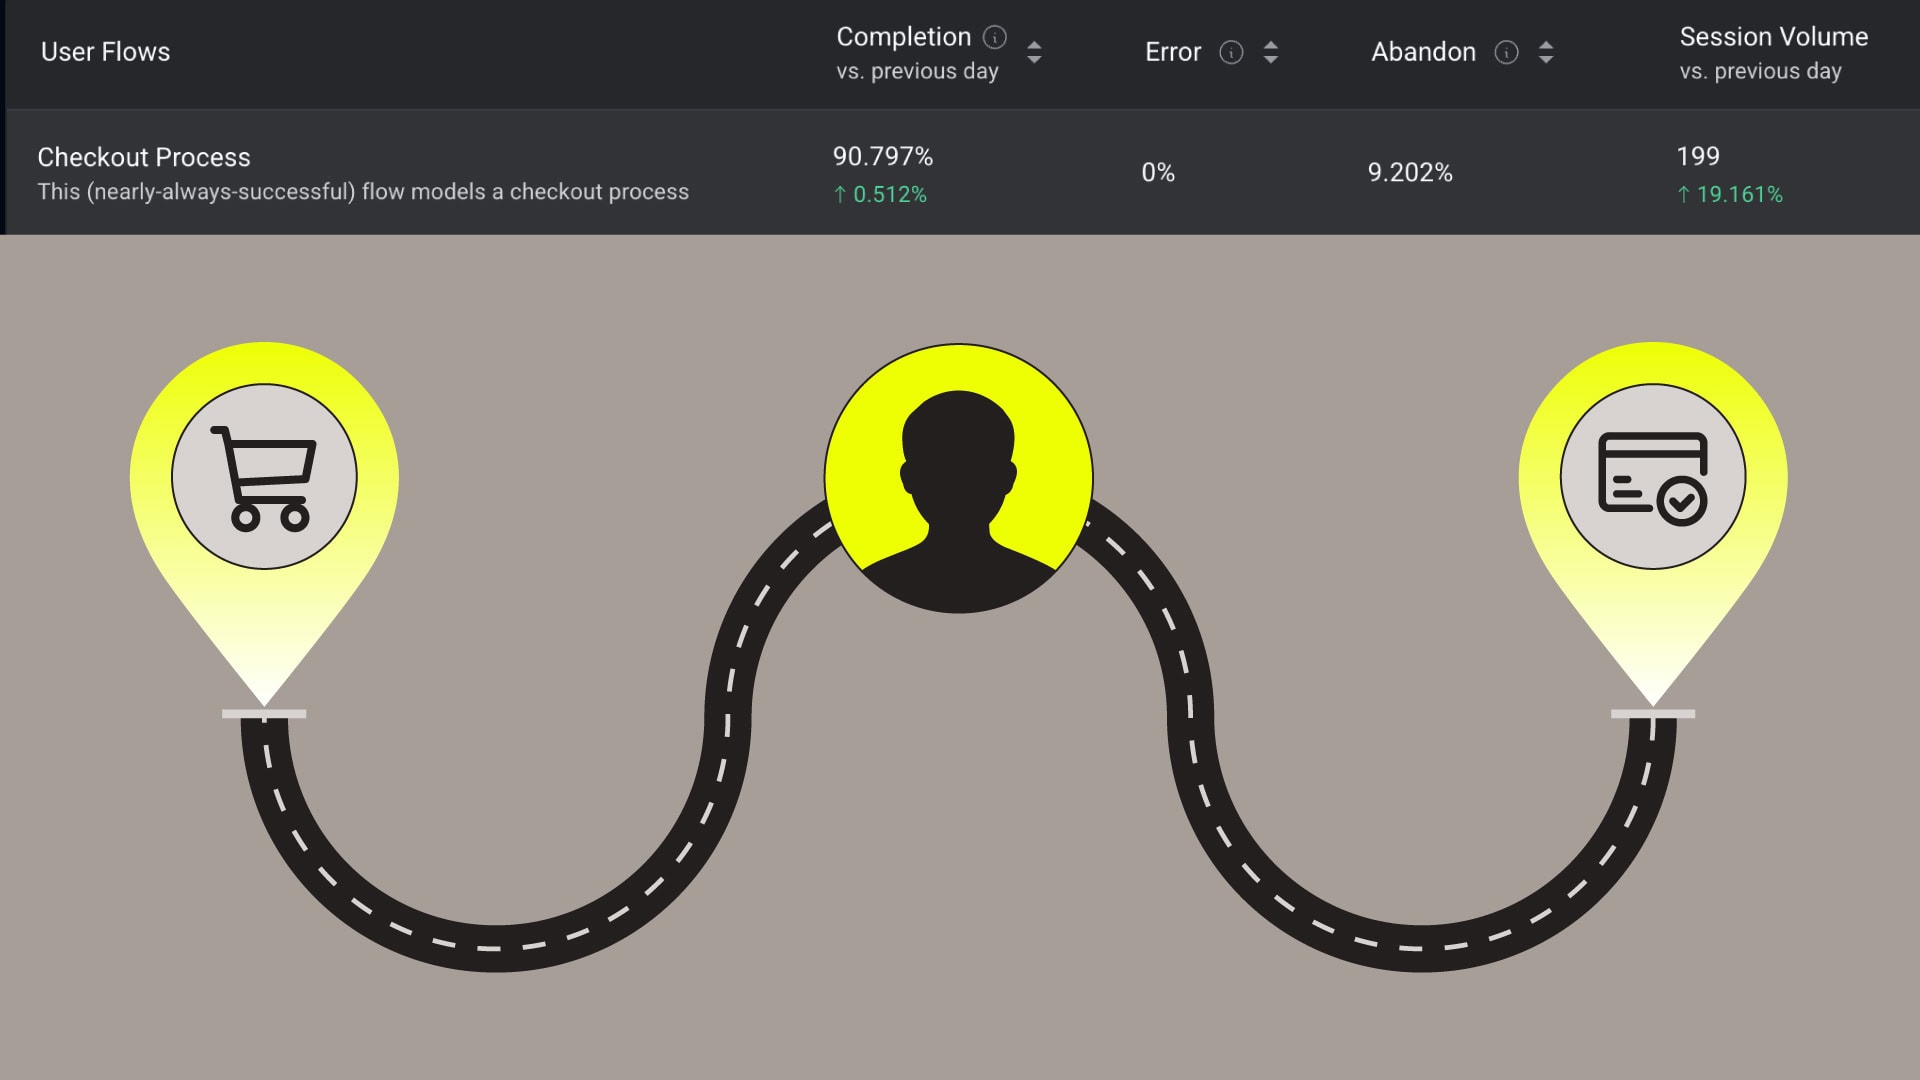
To help answer these types of questions, we’re building User Journeys – a platform capability that allows you to measure end-user engagement as a reliability signal. Today, we’ve released one of the core components of the User Journeys platform, User Flows.

Read on for a walkthrough of this exciting new feature. 

Discover how User Journeys helps engineering teams connect performance to real user impact.

Understanding User Flows

Traditional monitoring tools provide pieces of the picture: crash reports, service-level data, product funnels. But they rarely tell the full story of what a user actually experienced. Since the frontend is where users engage directly with software, observability must evolve to meet them there.

User Flows are a fundamental puzzle piece to build out that story with technical data.

User Flows are duration events that are created server-side between any two telemetry events that you are already emitting.  Flows are relatively short collections of events (think sub-5 minutes, ideally shorter). 

Examples of Flows include:

  • Searching and selecting a product
  • Creating a schedule
  • Updating financial info
  • Making a purchase

How it works

User Flows work in Embrace by seamlessly incorporating all telemetry events (spans, logs, breadcrumbs, network events, etc.) into one abstracted package of activity. This is done, at a technical level, by propagating a unique “flow attribute” between start and end points.

To use the feature, engineers simply select start and end points for the Flow they would like to track. 

Start and end points of the Flow can be configured based on numerous types of parameters, including spans, breadcrumbs, logs, and network events. This is done by selecting a parameter type from the drop-down options, then filling in the value for that parameter. Start and endpoints do not have to be the same data type (i.e. you can start a Flow on a span and end it on a breadcrumb). The last step to a Flow setup is setting a Timeout Threshold. We recommend keeping these as short as possible, but they must be less than 5 minutes, as Flows are intended to be the first-order grouping above granular telemetry events. Stitched flows and end-to-end User Journeys serve the purpose of capturing longer, more involved processes. 

What’s great about this process is that it requires no instrumentation to set up – it can all be done directly within the platform using existing instrumentation already in your code. 

Embrace will then start to track all of the activities within the bounds of this newly defined User Flow, capturing things like spans, events, logs, network calls, and any crashes or errors that occur within the confines of the Flow.

Engineers can then easily see the relatedness of traces and other data points to specific Flows and dive into the underlying telemetry, enhancing their ability to communicate problems to product managers with concrete, user-centric data.

Additionally, the User Flows system offers scoring and prioritization capabilities based on completion, abandonment, and error rates. You can quickly identify which Flows require critical attention based on how many unique users or sessions they are impacting, helping you to optimize your troubleshooting workflow and prioritization.

User Flows vs. tracing

Many engineers are familiar with tracing, a classic pillar (along with logs and metrics) within the observability practice. 

Tracing is an essential method for breaking down software operations into their smaller technical components, understanding the hierarchies between different processes and functions, and pinpointing the exact source of bottlenecks. 

What tracing does, ultimately, is help engineers troubleshoot duration problems and optimize specific code functions. Tracing also works best under the assumption that success is the default for operations being measured, typically because these operations are purely technical in nature and not influenced by human choice and behavior. A request to an authentication service, for example, is of course expected to succeed 100% of the time. If it does not succeed, or it succeeds after an unacceptable delay, the cause of this must be a technical problem with the service, the network, or something else. There is no question as to whether failures are due to end user abandonment or other unexpected behaviors because, by its very nature, an authentication request is completely removed from their influence. 

But what about the broader login process, of which the authentication request is only one step? Authentication may be a trace within a larger sequence of activity that also includes the user entering an ID and password, or opting into SSO, or completing a CAPTCHA test. 

Unlike the authentication itself, all of those activities require user interaction and therefore are subject to being influenced by user behavior. What if the login took a very long time, not because the authentication service was delayed, but because of rendering issues on the page that confused the user as to where they should enter their credentials? 

The end result is a frustrated user who may eventually disengage from your product if this issue happens repeatedly. But you wouldn’t necessarily know this until it was too late without having insight into the success of the broader user flow, not just the main service powering it.  

User Flows help engineers zoom out one level further from traces and spans so they can understand processes more holistically, as a user would, and also identify when behavioral, not just technical, variables are in the picture. 

Learn more and try it for yourself

User Flows are just the beginning of a wider platform initiative to help engineers monitor, analyze, and optimize the entire end user journey across their products.

If you’d like to learn more about User Flows, head over to our docs site, and keep an eye out as we announce additional features and capabilities.  You can get started for yourself with User Flows by starting a free trial with Embrace here

To see the feature in action, check out the overview below. 

Embrace Deliver incredible mobile experiences with Embrace.

Get started today with 1 million free user sessions.

Get started free
Related Content
Introducing User Journeys: Now user engagement is a reliability signal
Embrace's new User Journeys platform capability bridges the gap between product analytics and observability. Now, engineers can understand how technical performance impacts end user engagement by building custom flows and analyzing them with Embrace's powerful and highly-granular tooling.