Can't find what you need? contact us today to find it on the roadmap
Virna Sekuj
Virna Sekuj is a product marketer at Embrace. She has nearly ten years of experience in product management, marketing, and research analysis.
Prior to working at Embrace, Virna worked at Bose, Onside Sponsorship, and GWI. In her time with Embrace, she’s used her insight and analysis expertise to lead two research studies polling engineers that have produced two reports — The State of Mobile Experience and The Mobile Developers Pain Points report.
We're excited to extend our data forwarding capabilities to now include logs! Easily set up Logs Forwarding in the Embrace platform and start seeing high-context mobile logs in your OTLP-compatible observability backend of choice.
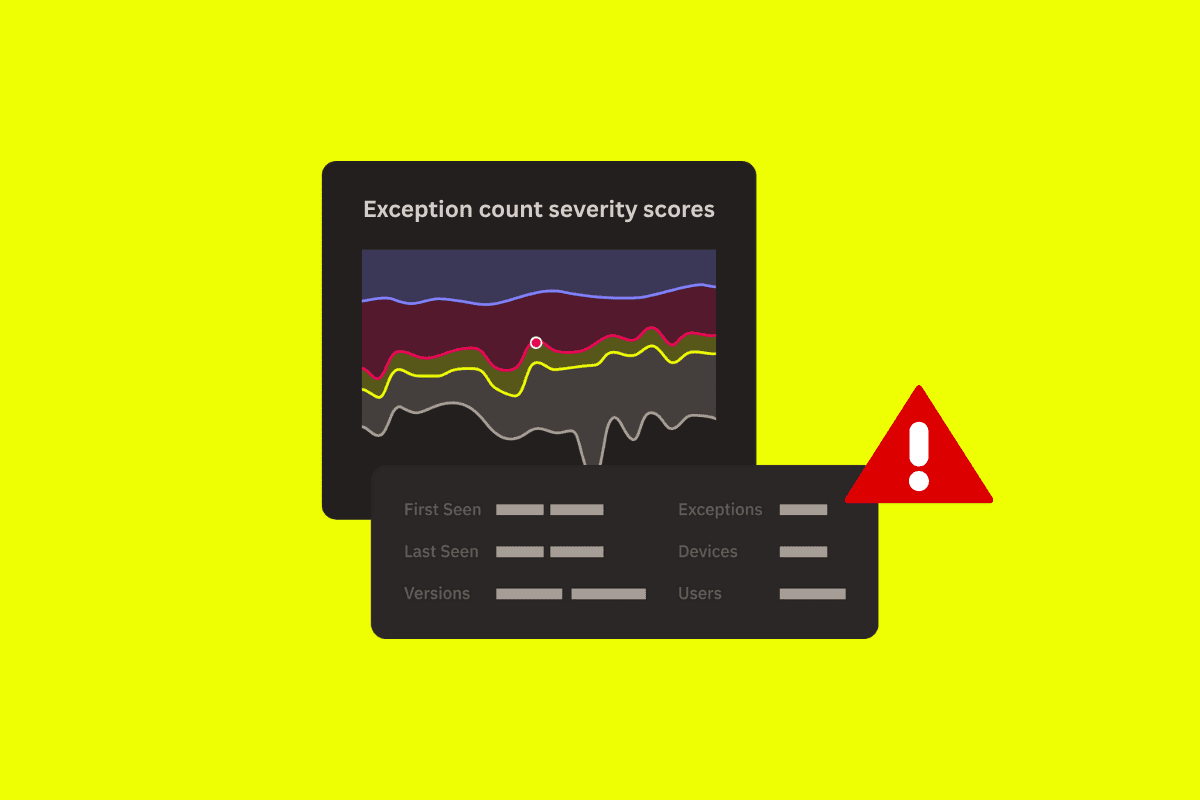
Embrace now automatically calculates a severity score for every JavaScript exception to help you prioritize the most critical issues affecting your users.
Our updated Release Health page gives engineers an effective launchpad to evaluate performance across app releases, examine trends, and quickly spot regressions. Plus, Embrace's Release Health connects you with the details you need to start troubleshooting a release issue – fast.