


With the proliferation of specialized tools to track different parts of software infrastructure, organizations today face a dilemma in achieving true end-to-end visibility of their system.
Do you stitch together the best apps for the job, or try to consolidate into a single tool at the expense of data quality? With Data Forwarding by Embrace, you don’t have to choose. Data Forwarding pushes the critical mobile signals you care about into the centralized monitoring, observability, security, or analytics system you’re already using for your backend – whether that’s Grafana Cloud, Datadog, New Relic, or another service.
Right now, you can use Data Forwarding to send Standard Metrics that Embrace has designed, as well as Custom Metrics that you can design yourself. Soon, you’ll also be able to forward Network Span and Performance Span data into your backend system via this product.
Data Forwarding works with a simple integration process that your Customer Success Manager will set up with you. You don’t need to manually use our API to query and push data yourself – although that’s a product we offer as part of our data ecosystem solutions, as well. You can learn more about our API here.
Read on for a feature overview of Embrace’s Data Forwarding.
What is Data Forwarding?
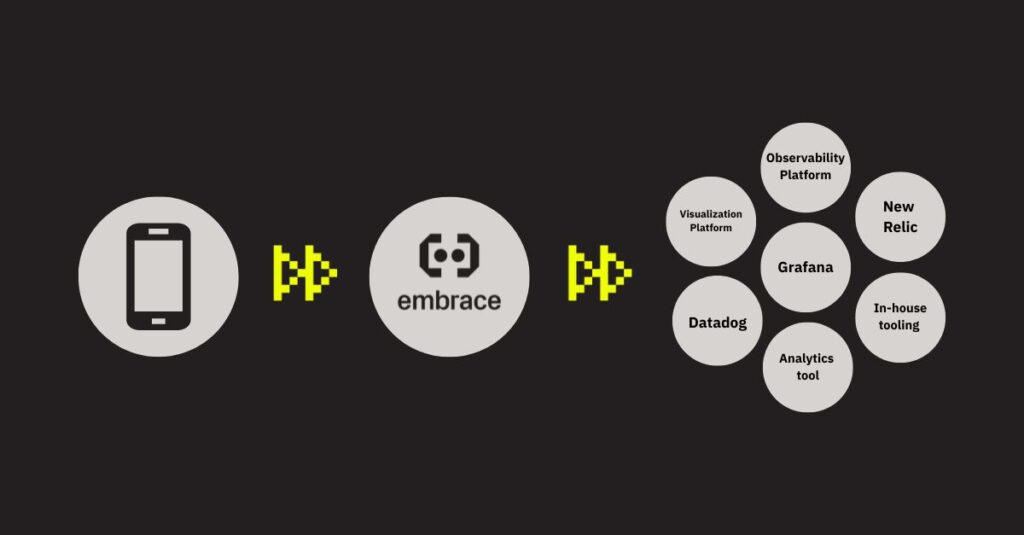
Data Forwarding is Embrace’s suite of ecosystem solutions that provide end-to-end visibility into your mobile app’s health and performance. Collectively, these solutions allow you to send preset metrics, custom-built metrics, and (eventually) span data about your mobile app health that Embrace tracks via our SDK to other services.
The underlying infrastructure of this system consists of a push API sending data from Embrace’s data stores to compatible 3rd-party endpoints via the OpenTelemetry Protocol (OTLP).
If you’re unfamiliar with OpenTelemetry, it’s an observability framework and toolkit designed to create and manage telemetry data such as traces, metrics, and logs. Using an OLTP-compatible product, like Embrace, has many benefits. OTLP is an open-source framework that is vendor and tool-agnostic; that means that it can be used with a broad variety of observability backends. It also lets you avoid vendor lock-in when setting up your monitoring systems.
Embrace’s Data Forwarding product is compatible with any back-end observability or data analysis and visualization system that adheres to OTLP standards. Some of the most widely-used of these include Grafana, Datadog, and New Relic. Embrace is an official data partner of Grafana, so you can take advantage of our seamless Data Forwarding integrations with Grafana Cloud and Grafana Dashboards. Learn more about the partnership here.
Standard Metrics Forwarding
The easiest way to get started with Embrace’s Data Forwarding is by using our pre-built set of metrics, the Standard Metrics. These are the most critical, commonly used metrics in mobile monitoring that give you an at-a-glance view of your app’s health. Once you connect Embrace with your observability back-end, Standard Metrics are there for you to view and analyze – right out of the box.
They consist of:
- Users total
- Sessions total
- Crashed users
- Crashes total
- Crash-free session rate
Additionally, you can look at any of these metrics filtered by the following dimensions:
- App version
- OS version
- Device model
As an example, you’re able to look at the crashes total metric grouped by app version in order to see how different versions are performing in terms of stability. This can help you quickly spot regressions.
Custom Metrics Forwarding
In addition to the Standard Metrics above, Embrace supports sending Custom Metrics through our Data Forwarding product.
Custom Metrics are exactly what they sound like – metrics that you, as the end customer, choose to build based off of the different types of data that Embrace collects from your app via our SDK. If you’re an Embrace user, your Customer Success Manager can help you set up your own Custom Metrics to then push to your supported external observability platform.
An important note: Custom Metrics, like Standard Metrics, are represented as either a count, sum, or duration – not as individual data points. This means that there must be some level of aggregation of data points to create a metric. For example, Embrace’s Data Forwarding pushes the total count of crashes in a given time interval to your endpoint, rather than pushing each individual crash and its corresponding metadata (i.e. timestamp, geolocation, etc.) to your endpoint.
For more info about our Custom Metrics offering, check out this blog.
Both Standard Metrics and Custom Metrics are represented as time-series data in your observability platform outside of Embrace. Metrics can be grouped by daily, hourly, and 5 minute intervals.
Coming Soon
Today, customers are able to push metrics as part of Embrace’s Data Forwarding solution. Soon, however, you’ll be able to push traces, spans, and – eventually – logs. Keep a lookout for the two upcoming feature releases below:
Network Span Forwarding (Alpha testing): Network requests made to your server end-point from a mobile device will be intercepted by Embrace’s SDK and sent to your observability backend as individual network spans. What makes this feature unique is that your backend system will now be able to see device metadata about every network call you intercept via Embrace – including what device made the request, what OS the device was running, whether it was on wifi vs. on a carrier network, etc. Network Span Forwarding is currently in alpha testing with select customers, so if you’d like early access to this feature please get in touch with your CSM. If you’re not an Embrace customer but would like to use this feature, get started here.
Performance Trace Forwarding: Similar to network span forwarding, this feature will allow for individualized pieces of data, rather than rolled up metrics, to be pushed to your observability endpoint. Customers set their own performance timers around a block of execution within their source code that they’d like to track, such as a checkout flow. Device metadata about the tracked execution flow and its performance is then sent to your backend monitoring system, so you can see the entire journey of a trace from the user to the server and identify at which service point an error may have occurred. This feature will provide maximal flexibility to truly measure what matters to you.
Data Forwarding represents a major step in Embrace’s suite of ecosystem solutions, making best-in-class mobile signals available right in your backend system. Keep an eye out as we continue to release more advanced functionality, integrations, and partnerships.
Want to explore Embrace for yourself? Get started for free here.