Network Monitoring
With Network Spans Forwarding in Embrace, you're only a click away from connecting client-side network requests to your backend observability platforms.
Networking issues in mobile and web apps can be incredibly challenging to solve without understanding the full journey that network requests take from the client to the server. Stop me if you’d heard this one before:
Now imagine a slightly different majorly improved scenario:
And no, this is not just a thought exercise. With Network Spans Forwarding, Embrace provides a powerful way to trace network requests from mobile and web apps to your backend systems for complete end-to-end visibility.
In this post, we’re excited to share that we’ve made it easier and faster to configure Network Spans Forwarding. Now, as soon as you spot a networking issue, you’re only a click away from connecting these client-side network requests to your backend observability platforms.

Let’s start with some background on how this functionality works. The Embrace SDK intercepts every network request your app makes and adds a unique identifier to it using w3c traceparents. These traceparent identifiers automatically propagate through the tracing products of Grafana Cloud, Honeycomb, Chronosphere, Datadog, and other observability platforms.
Within the Embrace dashboard, you can select the domains you’re interested in, and we’ll forward the associated network spans to those destinations. You can then use the trace-id portion of the traceparent to find your forwarded spans in your destination product.
Even better, you can also link from a forwarded network span to the individual session in Embrace with the emb.dashboard_session span attribute. Check out all available metadata on forwarded spans in our documentation.

If you haven’t done so already, you’ll first need to set up the observability platforms where you want to forward your network spans. Head to our Data Destinations documentation for setup guides, and then make changes easily in Settings > Integrations > Data Destinations.

You can now configure everything needed by heading to Settings > Integrations > Network Spans Forwarding in the Embrace dashboard.

Quick note: All configuration is managed at the organization level. Domain patterns, app selections, and destination settings are shared across your entire organization, making it easy to maintain consistent forwarding rules.
Another quick note: Network Spans Forwarding is available for Enterprise plans and Trial accounts. If you’re on a Pro or Free plan, please contact support at support@embrace.io to upgrade to Enterprise.
Choose which of your organization’s apps you’d like to send network spans from.

You can add domains by entering the exact string to match on or by creating a regex to match patterns on.

Scroll down and save your settings to enable them. For tips on validating your configuration or troubleshooting issues, check out our documentation.
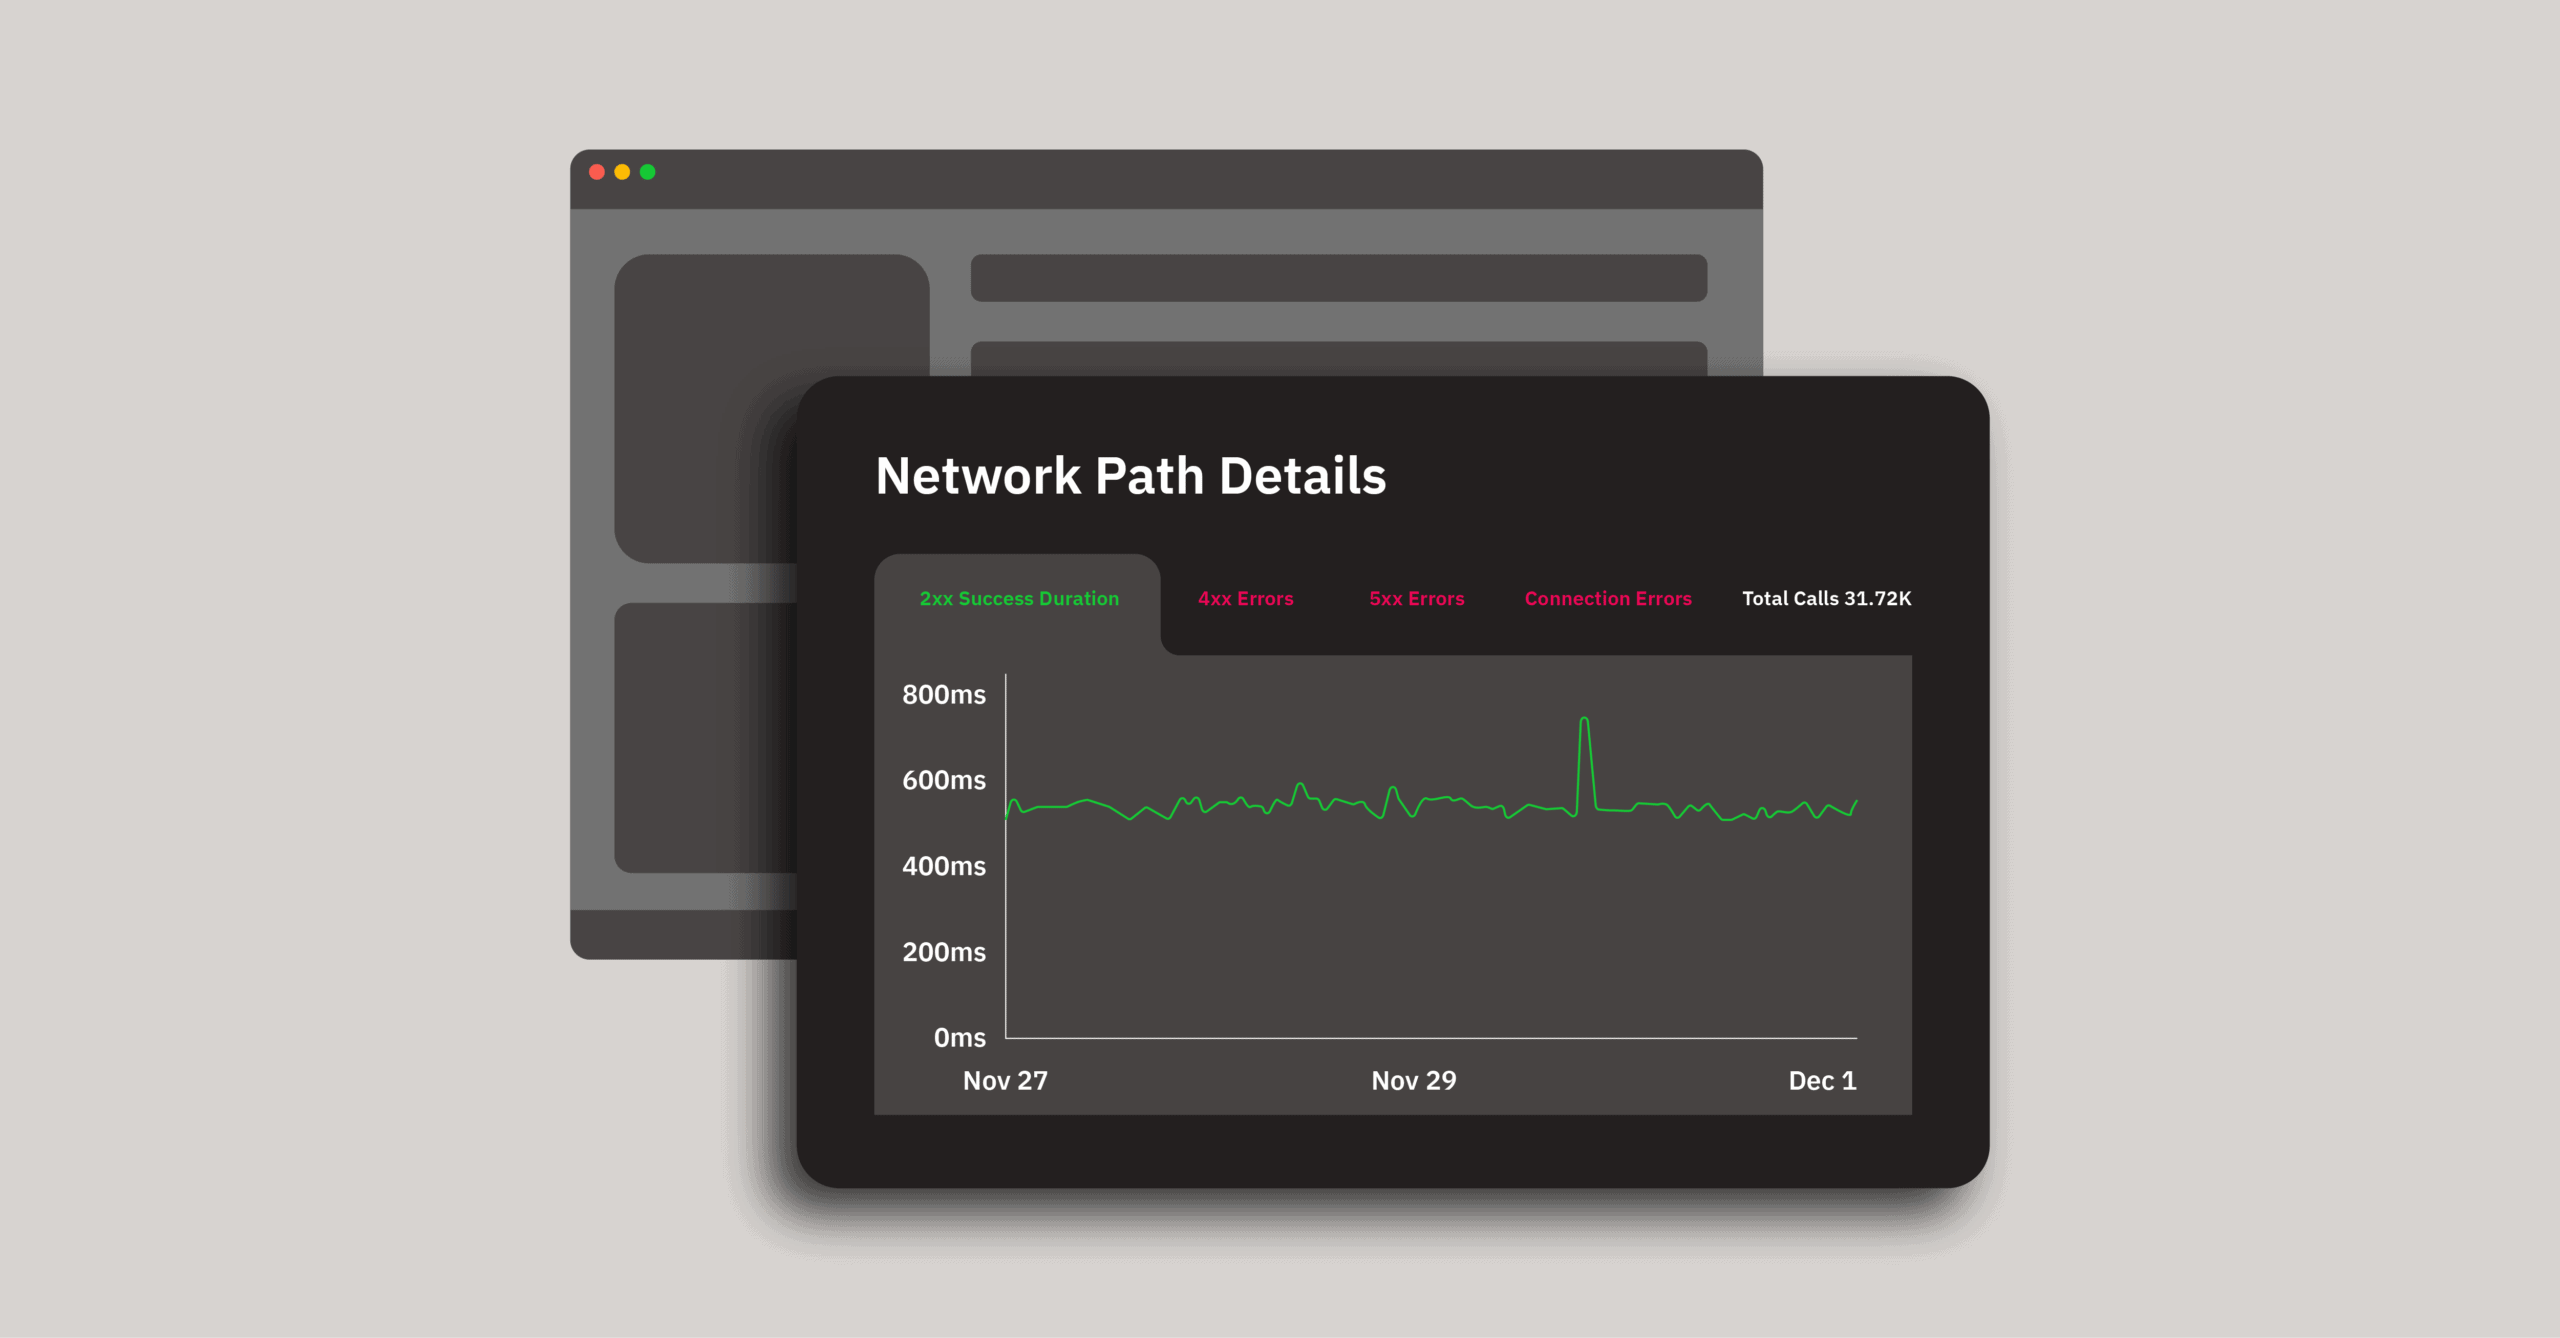
Once you have your Network Spans Forwarding settings in place, you can add new domains in a single click from the Network Path Details page or the User Timeline page.

In the User Timeline page, you can expand any network request row to access the “Enable Network Spans Forwarding” button.

If you turn on a domain and realize you need to make changes, no problem! Just head to Settings > Integrations > Network Spans Forwarding, make edits, and click save. Embrace will update the configured domain patterns and start/stop forwarding based on your changes.
Network Spans Forwarding helps engineering teams see the full journey of network requests from the client to the server, and it’s incredibly helpful for understanding the source and impact of networking issues on your end-users.
We’re excited to make it faster and easier for you to configure Network Spans Forwarding in Embrace. We also provide additional ways to connect client-side telemetry with your existing observability backends. Check out our Logs Forwarding and Metrics Forwarding capabilities to learn more.
Get started today with 1 million free user sessions.
Get started free