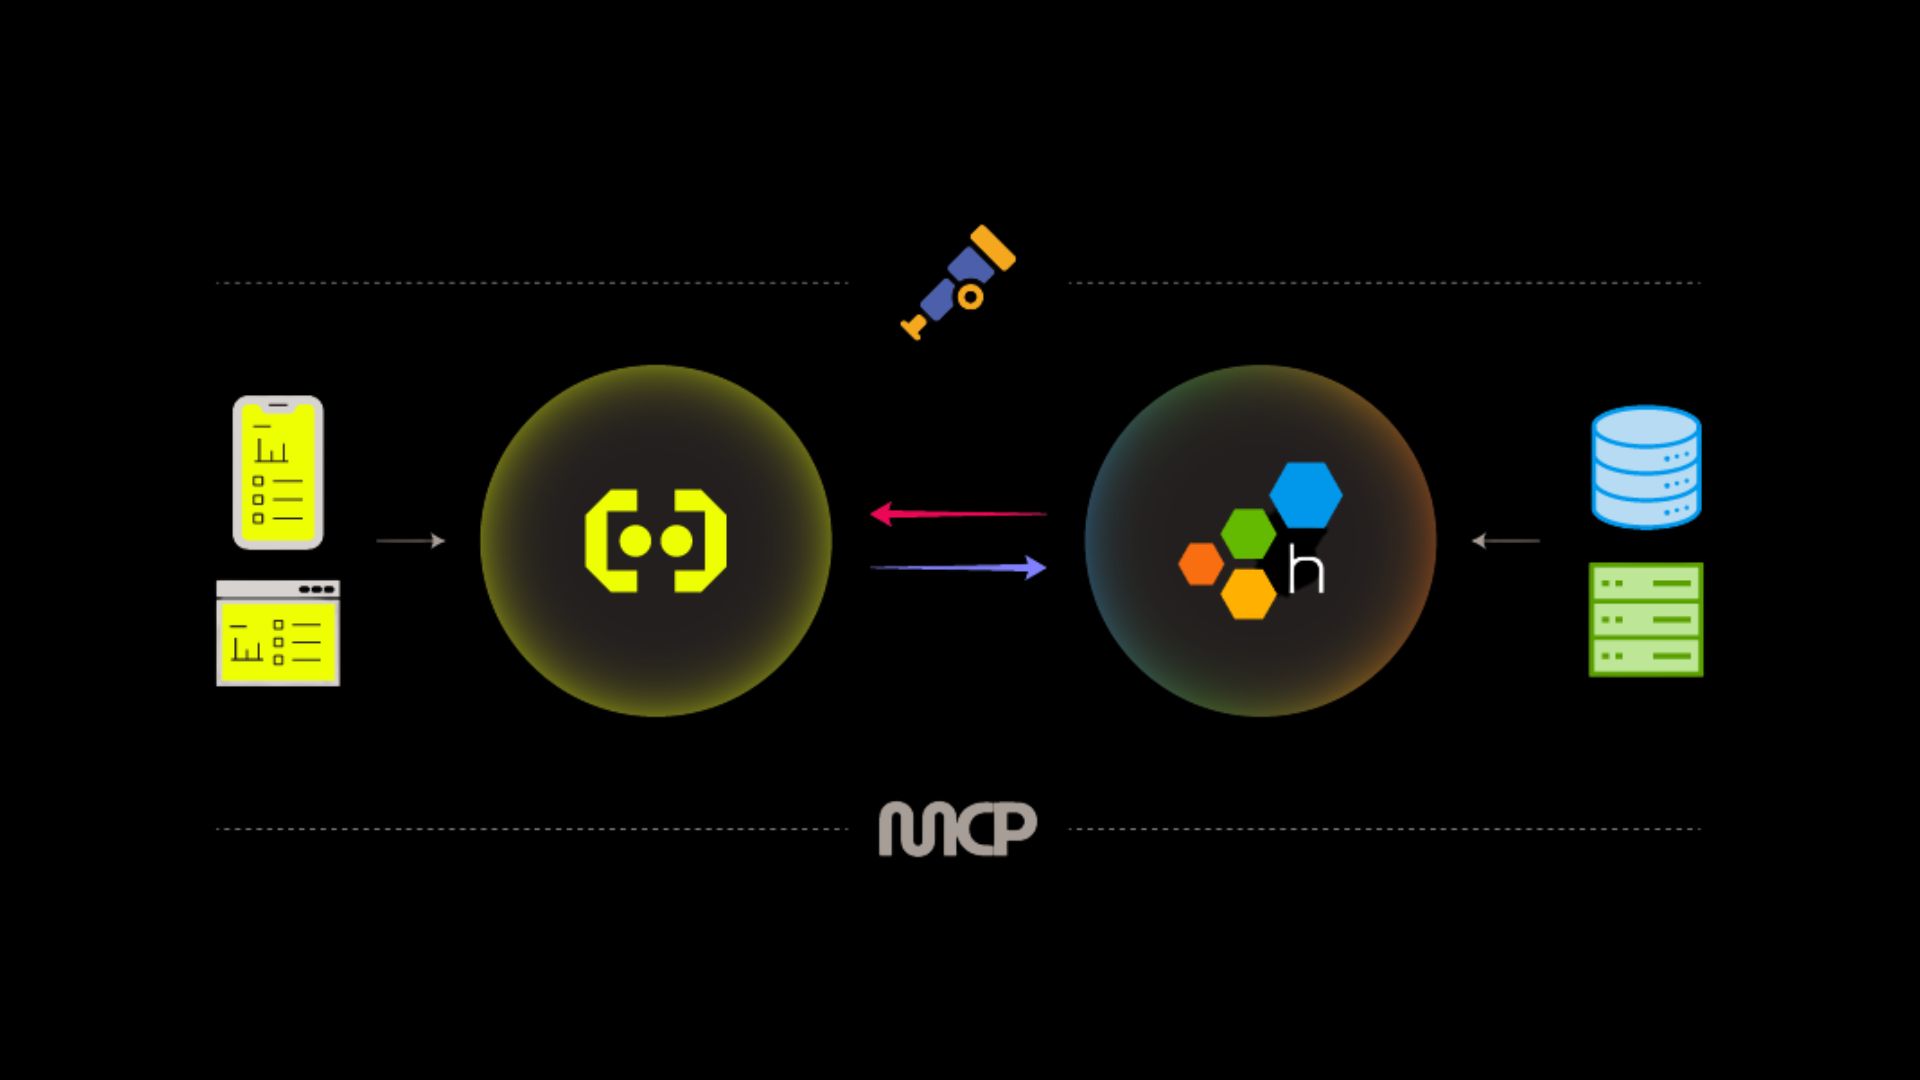
A new strategic partnership with Honeycomb brings Embrace's web and mobile RUM together with industry-leading services observability, so engineering teams can finally follow a problem from the backend straight to the users feeling it.
The larger AI landscape moves ever faster, and the same is true for innovation at Embrace. We launched the Embrace MCP Server in beta just over a month ago, and the feedback from customers has been incredible. We love hearing about all the different ways you’re incorporating Embrace data into your AI workflows, so keep that feedback coming!
Logs are an invaluable tool for detecting and investigating all kinds of events in the application lifecycle. Sometimes, however, a standard record of a log is not enough. That's why we at Embrace have been working steadily to provide data enrichment features specifically for logs. The latest of these is our logs attachment capability, which allows engineers to attach different file types of up to 1 MB in size to log records, adding a layer of context for improved diagnostics and troubleshooting.
React Native developers rejoice! Embrace's React Native SDK is open source and now fully OpenTelemetry-compliant. So you'll get best-in-class, flexible tooling to monitor your React Native apps while still adhering to OTel data standards. You can even use the SDK to send out telemetry to any OTLP-HTTP endpoint without going through the Embrace backend or platform at all!
To understand how quickly end users can interact with your application screens, you can use spans and traces around key rendering events. Now, Embrace is making it easier than ever to do so by providing automatic instrumentation for screen rendering and interactivity, available for both Android and iOS.
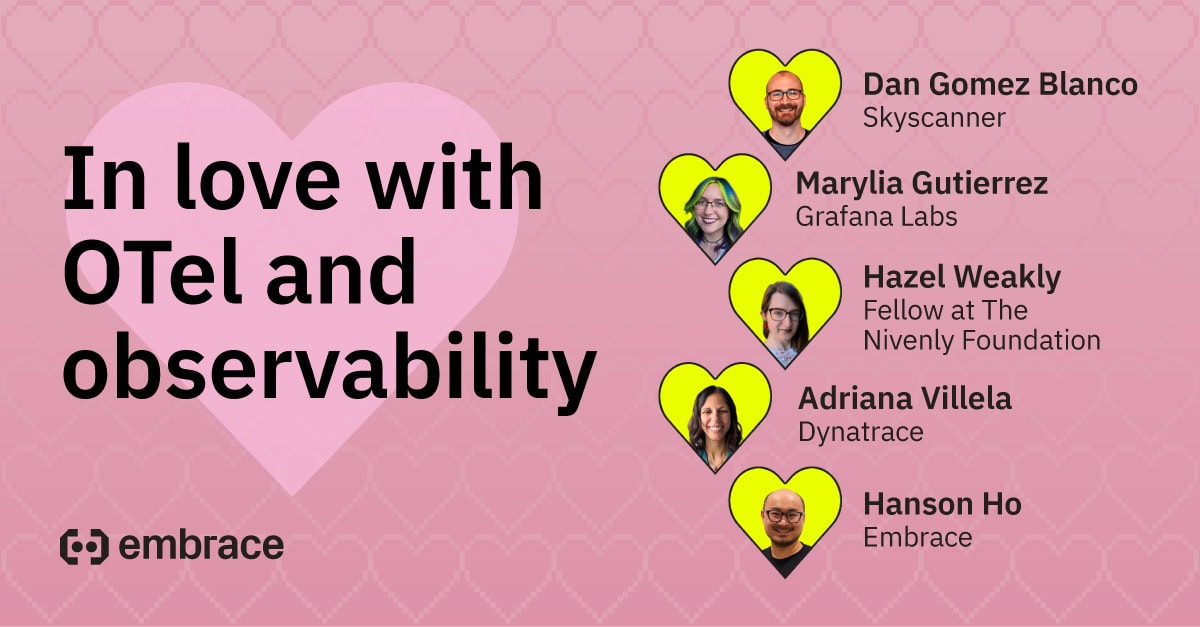
Watch this OpenTelemetry expert panel to learn about the most loved (and hated) parts of everyone’s favorite observability framework. And to play “Fling, Marry, Kill” with logs, metrics, and traces.
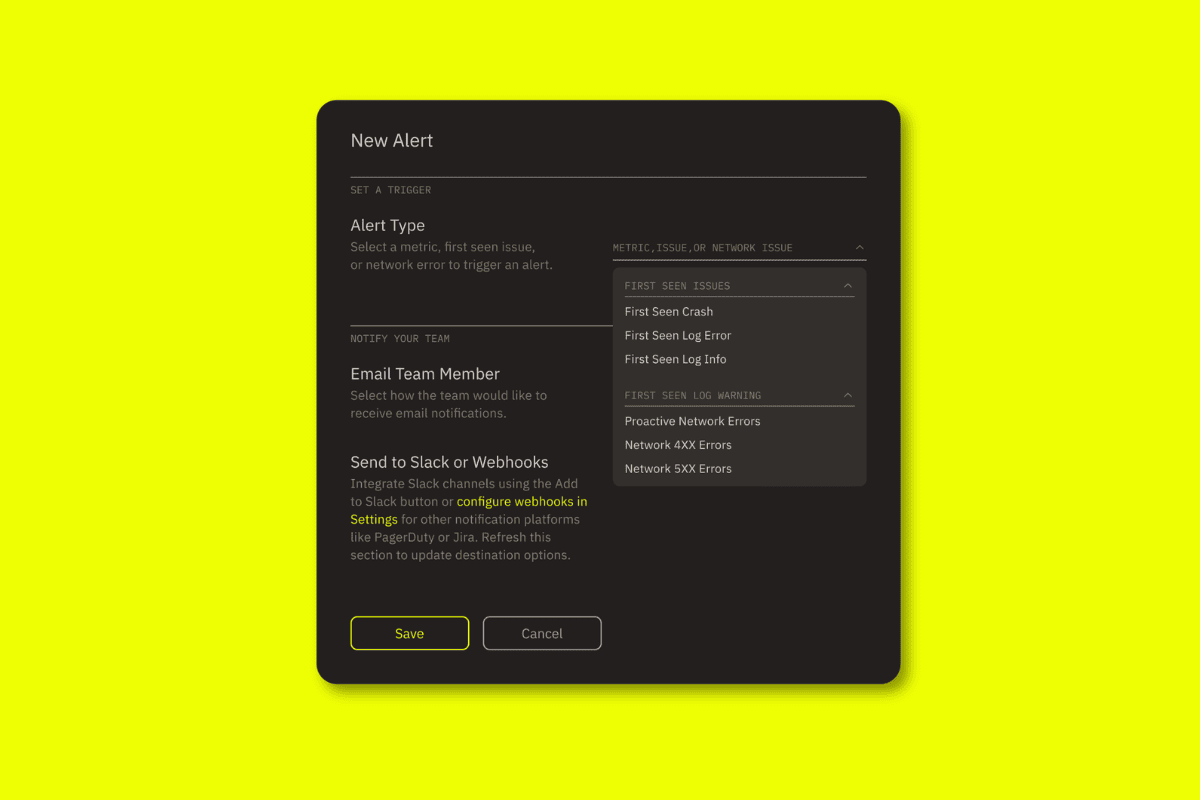
Mobile telemetry is often delayed in reaching the servers, and your observability tooling. This can impact how alerts are interpreted, making it harder to see the real picture of your app's performance at any given time. Embrace's new enhanced alerting visualizations with delayed data are now here to help solve this issue.
OpenTelemetry can be a powerful tool for observing mobile apps. Read along as we use the OTel-Swift SDK to trace app activity from disparate parts of an iOS code base.
Embrace's React Native SDK team created an OpenTelemetry-compliant instrumentation library for tracking navigation flows. Learn about the challenges, key decisions, and how you can use this instrumentation in your React Native apps today!
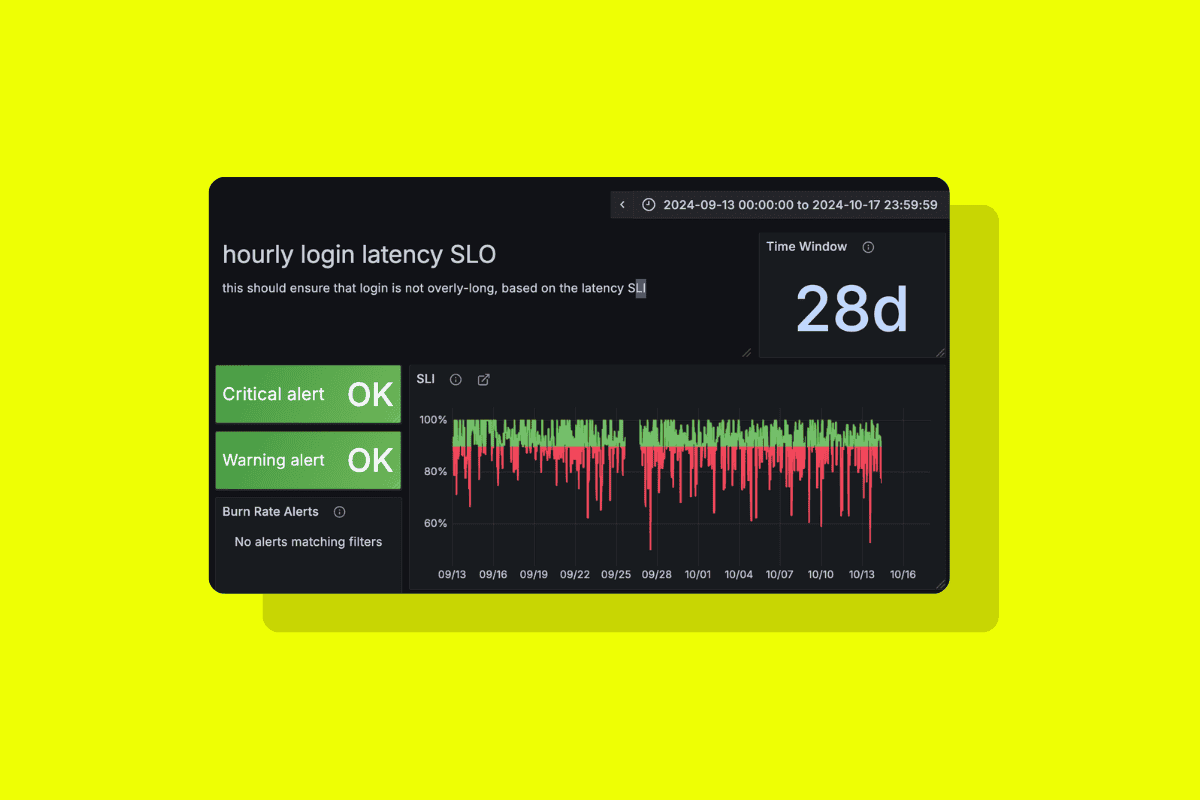
Engineering teams use mobile SLOs to monitor user flows and ensure user-impacting issues are detected and resolved quickly. In this tutorial, we'll show you how to use Embrace, in combination with Grafana, to build and monitor mobile SLO for your app – from initial app instrumentation, all the way to connecting to backend dashboards and alerts.
Embrace's Data Destinations work by collecting data through the Embrace SDK, generating structured metrics, and transmitting them using OpenTelemetry. Learn how the Embrace engineering team built this system and how it addresses several key challenges in mobile metrics collection.