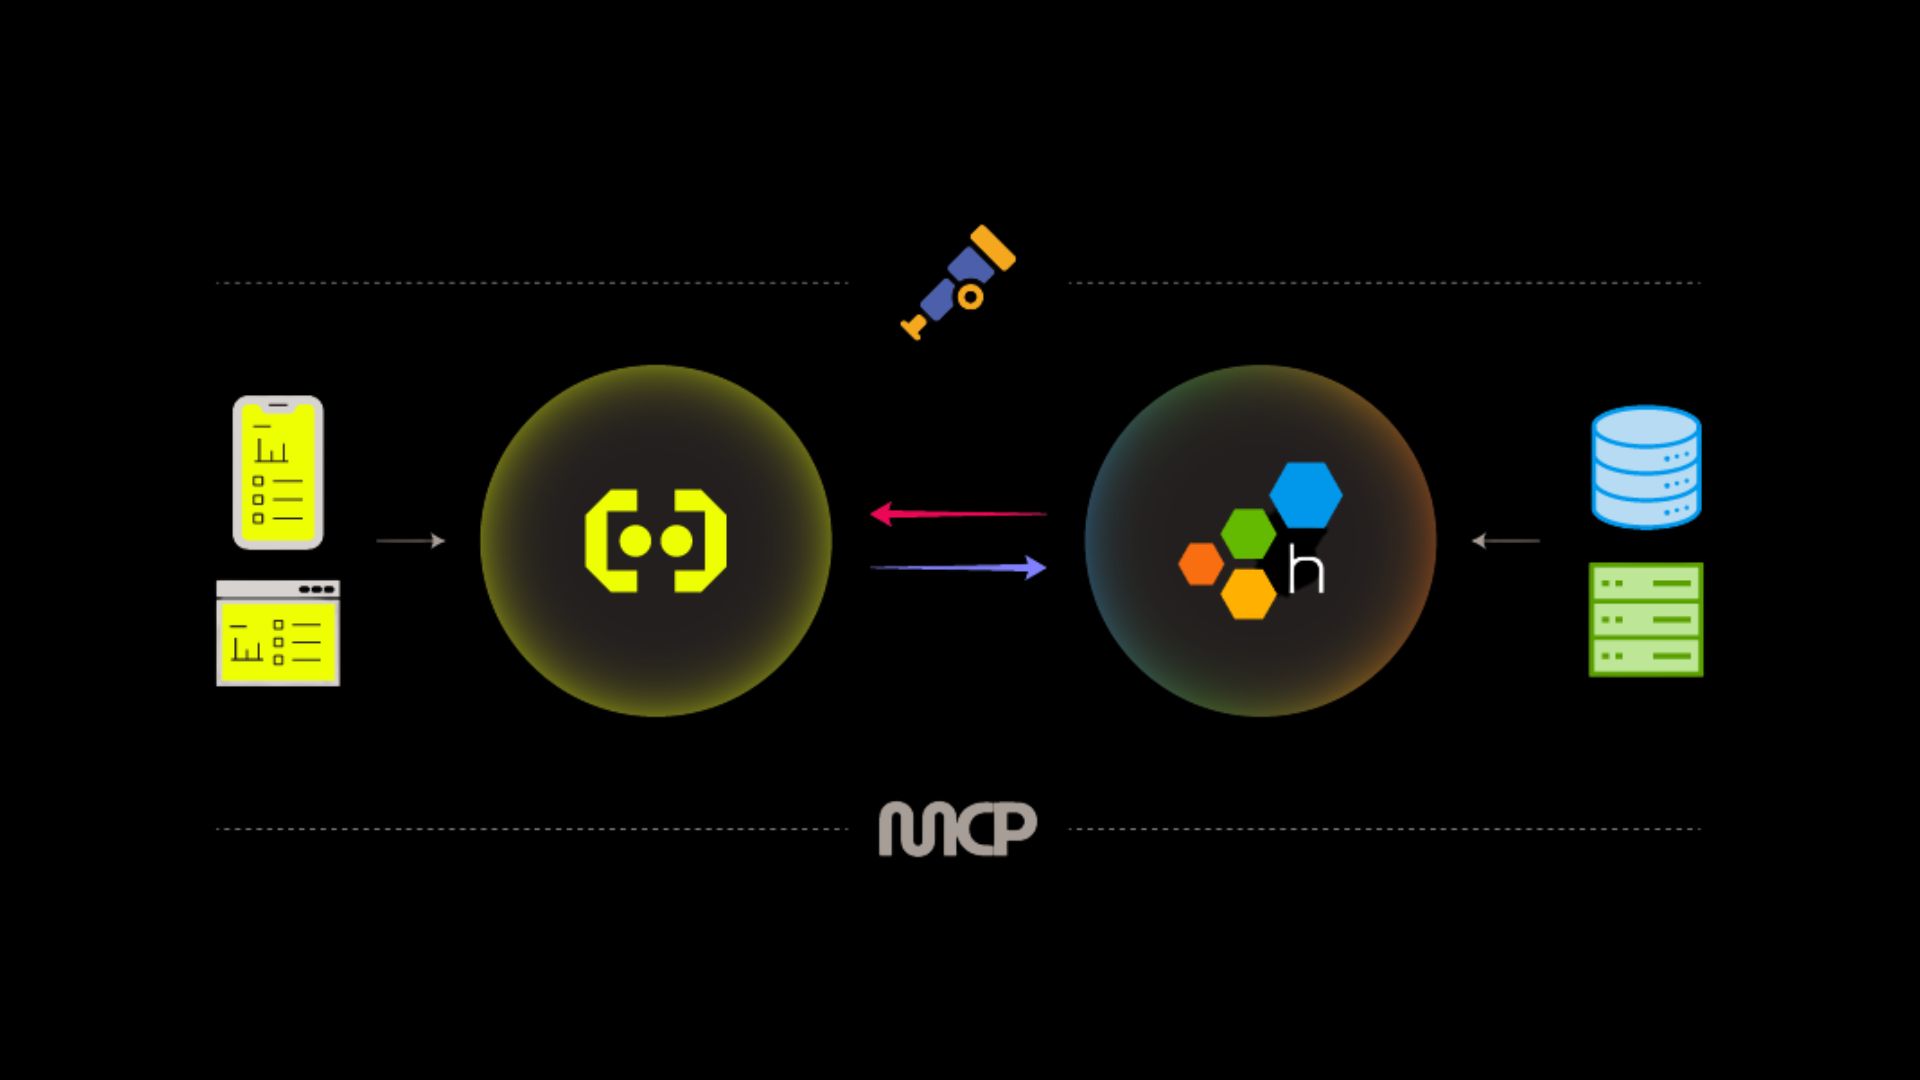
A new strategic partnership with Honeycomb brings Embrace's web and mobile RUM together with industry-leading services observability, so engineering teams can finally follow a problem from the backend straight to the users feeling it.
The larger AI landscape moves ever faster, and the same is true for innovation at Embrace. We launched the Embrace MCP Server in beta just over a month ago, and the feedback from customers has been incredible. We love hearing about all the different ways you’re incorporating Embrace data into your AI workflows, so keep that feedback coming!
We're excited to release our new guide for DevOps, SRE, and mobile teams around building better SLOs. This guide will help teams design and implement SLOs that address the incredibly complex, unpredictable nature of mobile in a way that centers the end user experience.
We're excited to introduce the new Logs Experience, which contextualizes logs within the full user experience, supports larger log messages, and presents a number of analysis updates for unrivaled troubleshooting capabilities.
The past few weeks have been a testament to the keen interest in today’s trends – and future innovations – for mobile observability. The Embrace team has been busy joining the industry’s most opinionated thought leaders on podcasts for candid conversations around the role mobile plays in the rapidly evolving observability ecosystem.
We’ve rounded up our favorites from the Embrace summer podcast tour, with standout takeaways and quotes. If one thing comes across, it’s that proactively understanding how your users are experiencing your mobile applications is a challenge and an opportunity for teams today. Consumer behavior has changed so quickly…can engineering teams keep up?
Sit back and tune in – we’ve taken notes for you already.
At Embrace, we've been excited about meeting and growing the OpenTelemetry specification for some time now. We also have a ton of domain-specific knowledge about how mobile telemetry should be collected and processed. This led to a decision point while rebuilding our mobile SDKs to emit OpenTelemetry primitives: how can we quickly inform the data ingest layer about the types of telemetry we're sending, to make its life easier?
Embrace captures all the data from all the sessions of an app. Your Error Logs, successful and failing Network Requests, and screen tap locations are all recorded by the mobile app client. That’s a lot of data. Too much data to be constantly monitoring.
Embrace's Android OpenTelemetry (OTel) SDK now supports the standard OTel Tracing API, meaning that spans instrumented by the OTel Tracing API will be seamlessly consumed by the Embrace SDK, just as if they were created using our proprietary tools. This gives customers greater flexibility to instrument and monitor what really matters to them, without having to adopt a different tracing standard.