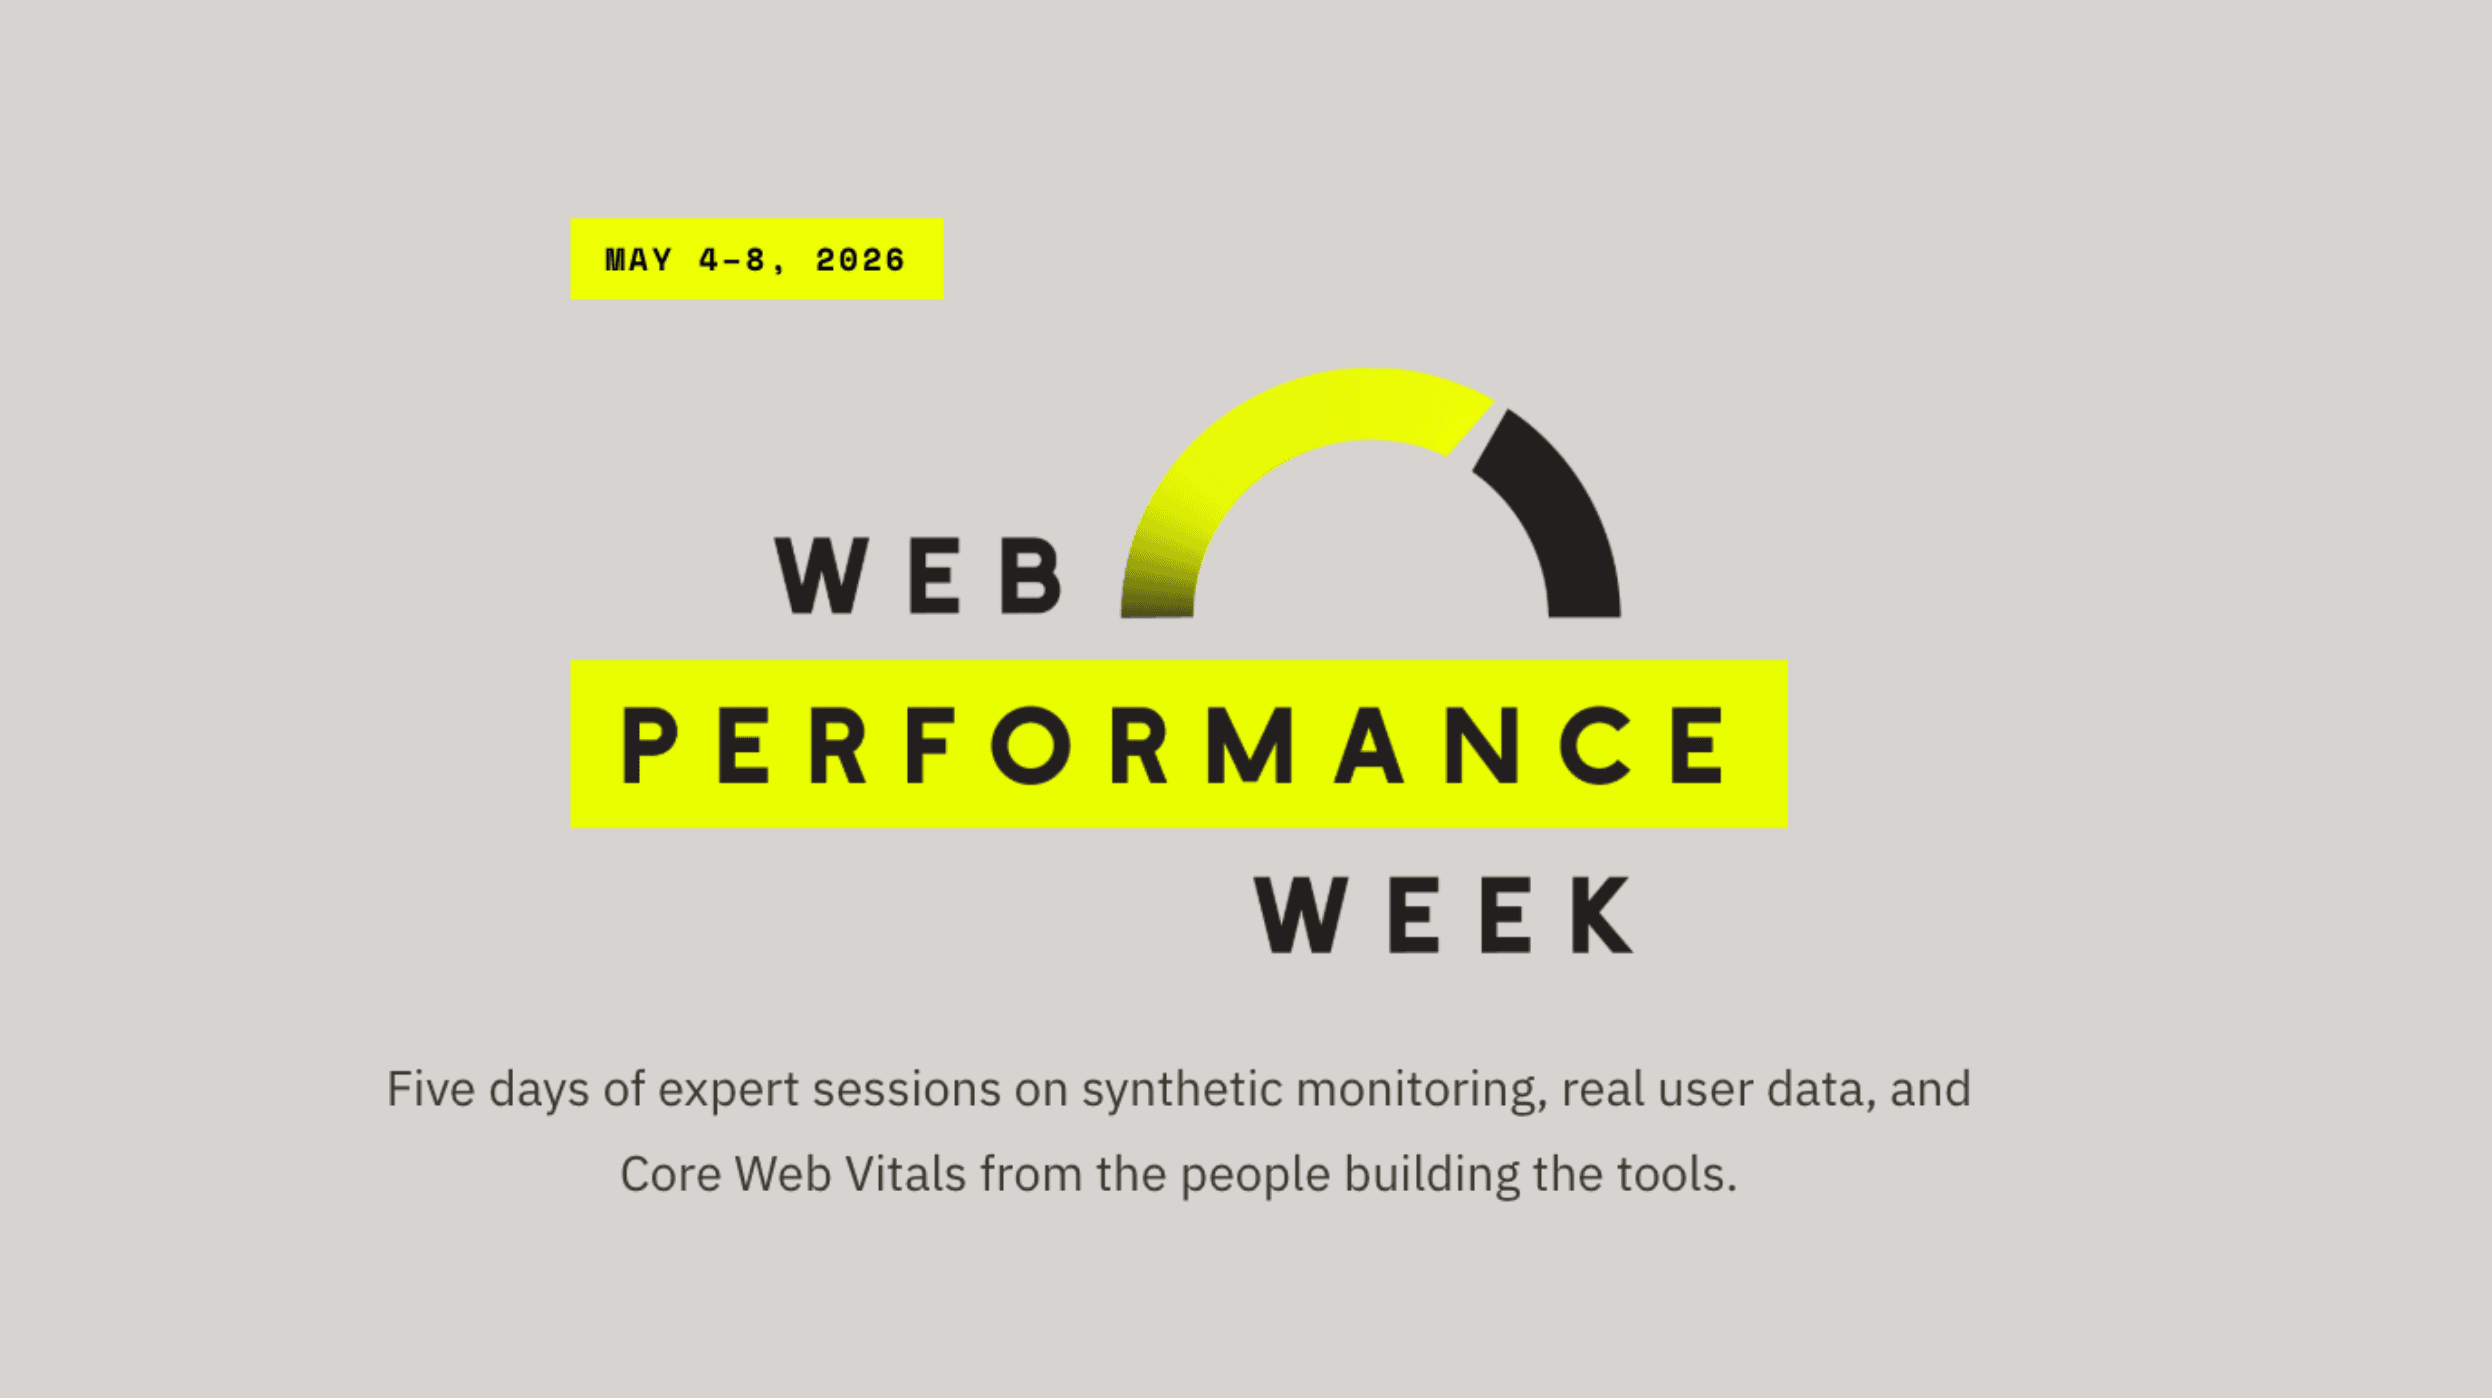
Core Web Vitals transformed how entire organizations think and talk about web performance. Mobile deserves an equivalent framework — one that's rigorous, user-focused, and tied to real business outcomes. We're building it. Here's how.
We surveyed 300 frontend engineering teams. 89% use AI in their workflows, but only 8% apply it to observability. See what drives the gap and how your team compares.
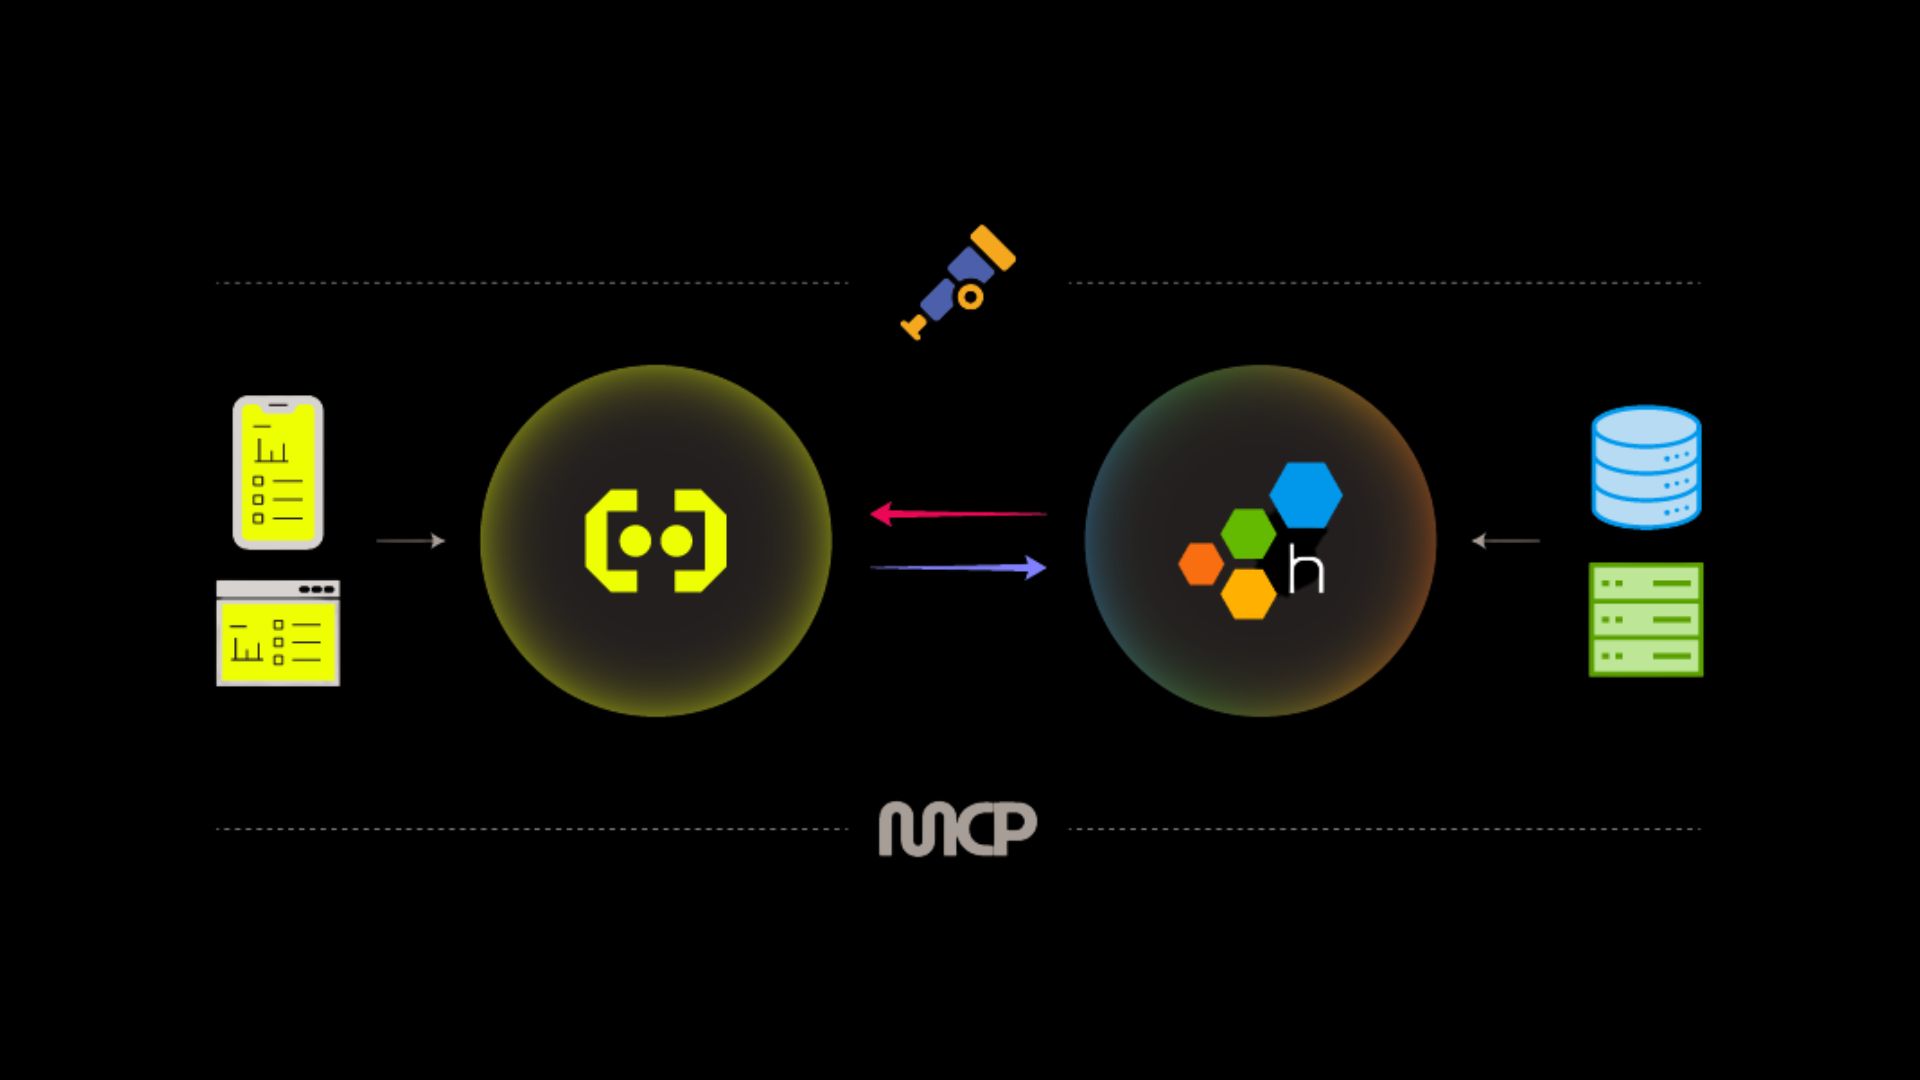
A new strategic partnership with Honeycomb brings Embrace's web and mobile RUM together with industry-leading services observability, so engineering teams can finally follow a problem from the backend straight to the users feeling it.
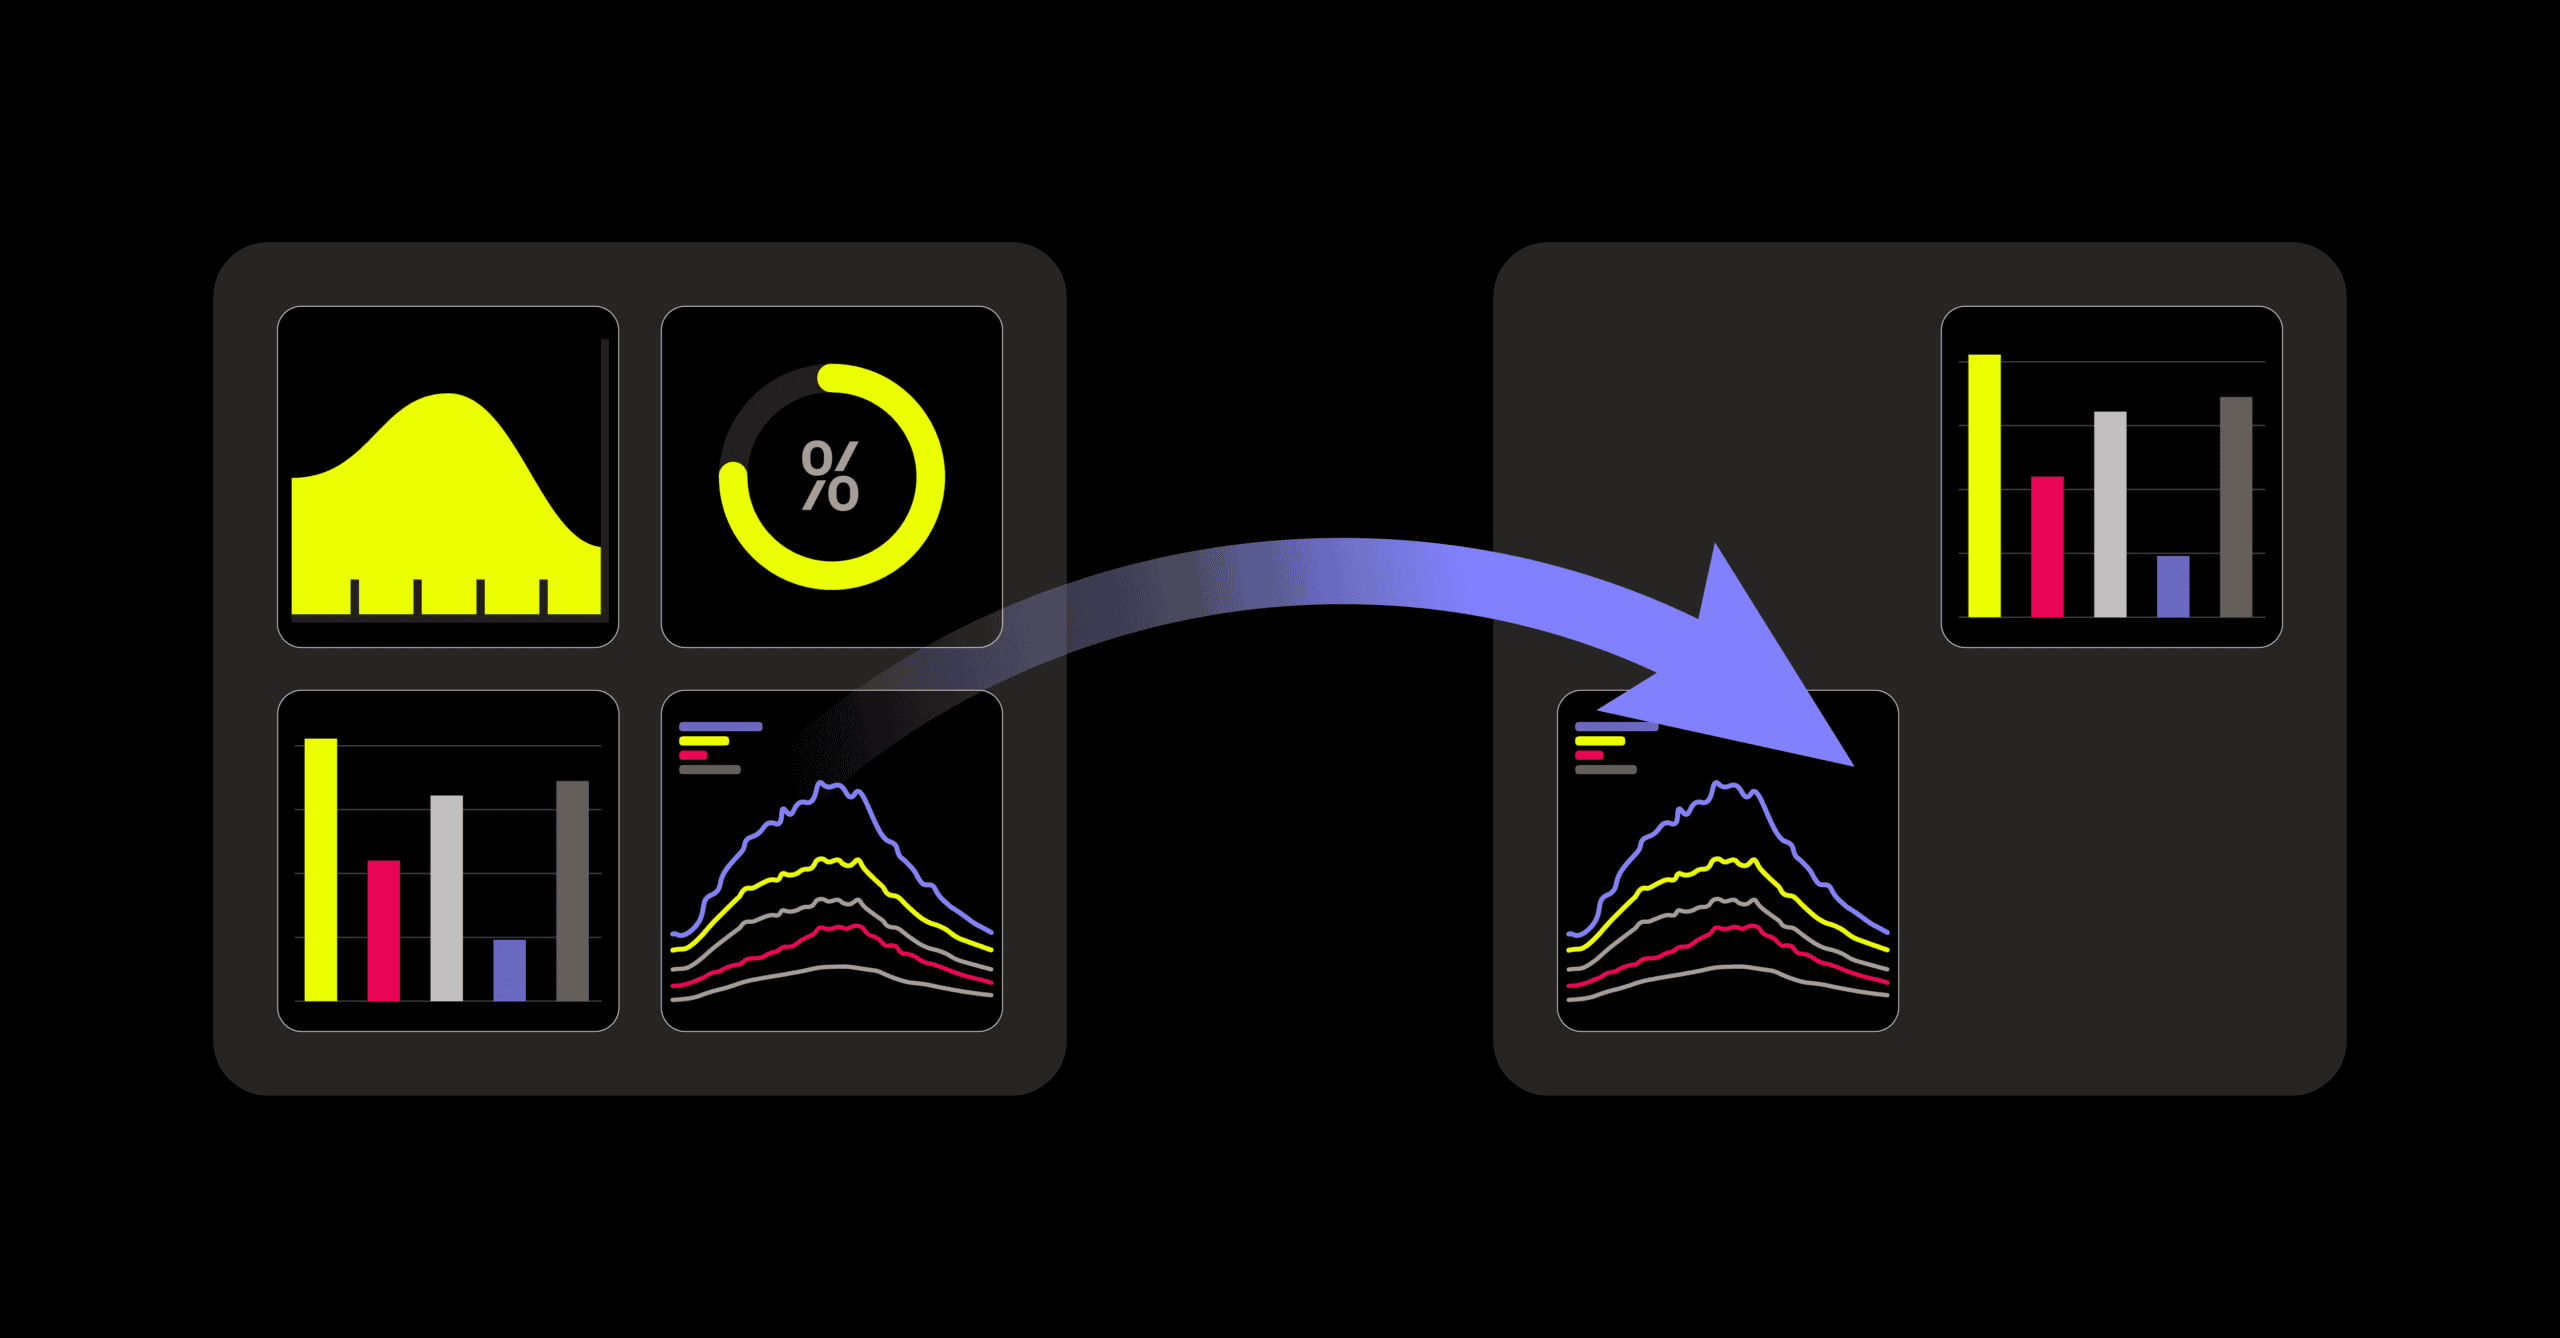
Answering your most complex questions about issues affecting yours users is now faster and easier. KPI, gauge, pie chart, and bar chart widgets now support multiple queries and custom formulas.
If you want to get the attention of non-technical stakeholders, these are the three most powerful charts to immediately grab folks' interest and get them to care about site speed and user experience.
Discover the best bug tracking tools of 2023. These tools are intuitive, easy to use, and effective in helping mobile teams solve bugs. Choose the best tool for your needs.
Contribution continues Embrace’s investment in vendor-agnostic, open-source instrumentation in frontend and mobile by extending support to Kotlin and Kotlin Multiplatform