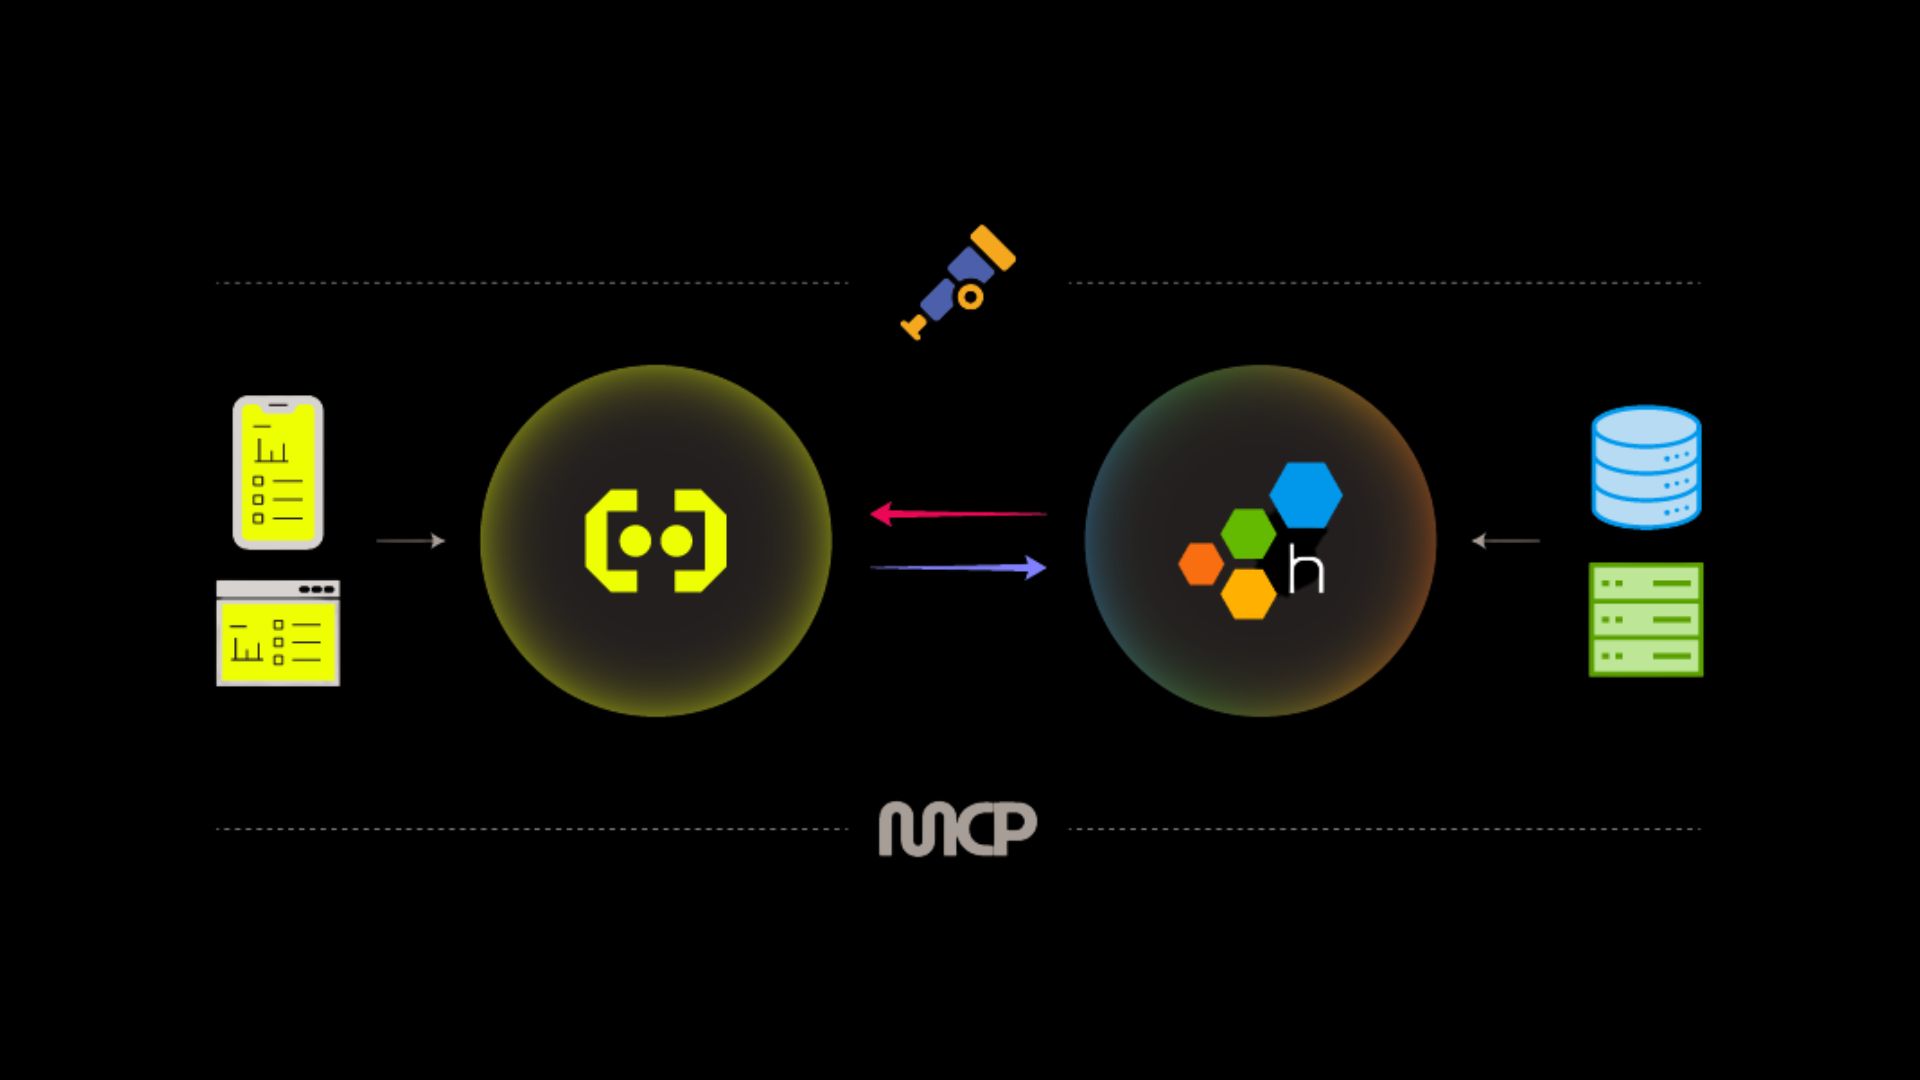
Embrace: Modern mobile observability built on OpenTelemetry
Embrace combines open-source SDKs with an analysis dashboard to help the entire engineering team understand exactly what is disrupting mobile user experiences.
Read moreNEW RESEARCH REPORT: OpenTelemetry for Mobile: What's now and what's next
Download nowTop Search Terms CRASH REPORTINGUSER SESSION INSIGHTSNETWORK MONITORINGALERTINGand CUSTOM DASHBOARDS.
Can't find what you need?
contact us today to find it on the roadmap
Embrace combines open-source SDKs with an analysis dashboard to help the entire engineering team understand exactly what is disrupting mobile user experiences.
Read moreEmbrace's integration with Grafana now supports back-linking. That means you can seamlessly navigate from Embrace data in your Grafana instance directly to the relevant data in your Embrace dashboard for immediate analysis and troubleshooting.
Read moreIn this data report from Embrace, learn how devices, operating systems, app versions, unpredictable network conditions, and more contribute to the complexity of the modern mobile environment.
Read moreAt Embrace, we've been excited about meeting and growing the OpenTelemetry specification for some time now. We also have a ton of domain-specific knowledge about how mobile telemetry should be collected and processed. This led to a decision point while rebuilding our mobile SDKs to emit OpenTelemetry primitives: how can we quickly inform the data ingest layer about the types of telemetry we're sending, to make its life easier?
Embrace captures all the data from all the sessions of an app. Your Error Logs, successful and failing Network Requests, and screen tap locations are all recorded by the mobile app client. That’s a lot of data. Too much data to be constantly monitoring.
Embrace's Android OpenTelemetry (OTel) SDK now supports the standard OTel Tracing API, meaning that spans instrumented by the OTel Tracing API will be seamlessly consumed by the Embrace SDK, just as if they were created using our proprietary tools. This gives customers greater flexibility to instrument and monitor what really matters to them, without having to adopt a different tracing standard.
Embrace's latest upgrade to our performance tracing feature lets engineers see all the network requests that occur in a user flow as individual spans within a larger trace instance. Engineers can now better understand the temporal relationship between network activity and other events within a flow, leading to quicker insights and faster issue resolution.
Embrace reduced storage costs by 70% by creating an open source module for efficiently storing and retrieving objects from a single file in S3.
Embrace engineers share a few key learnings from supporting larger log sizes, including working around a current limitation in ClickHouse and testing several skip indices to optimize query performance and storage cost.
Enable full-stack observability with unparalleled visibility into mobile user experiences.
Traditional logging tools miss the mark for mobile engineers who need more detail and better, actionable data. With Embrace’s OpenTelemetry Logs in Context, engineers now get the full scope of logging resources they need to effectively troubleshoot their issues.
Learn how the Embrace iOS team decided to open source versus build in public as well as what their CI/CD process is for delivering new SDK releases into the public repo.