Core Web Vitals transformed how entire organizations think and talk about web performance. Mobile deserves an equivalent framework — one that's rigorous, user-focused, and tied to real business outcomes. We're building it. Here's how.
We surveyed 300 frontend engineering teams. 89% use AI in their workflows, but only 8% apply it to observability. See what drives the gap and how your team compares.
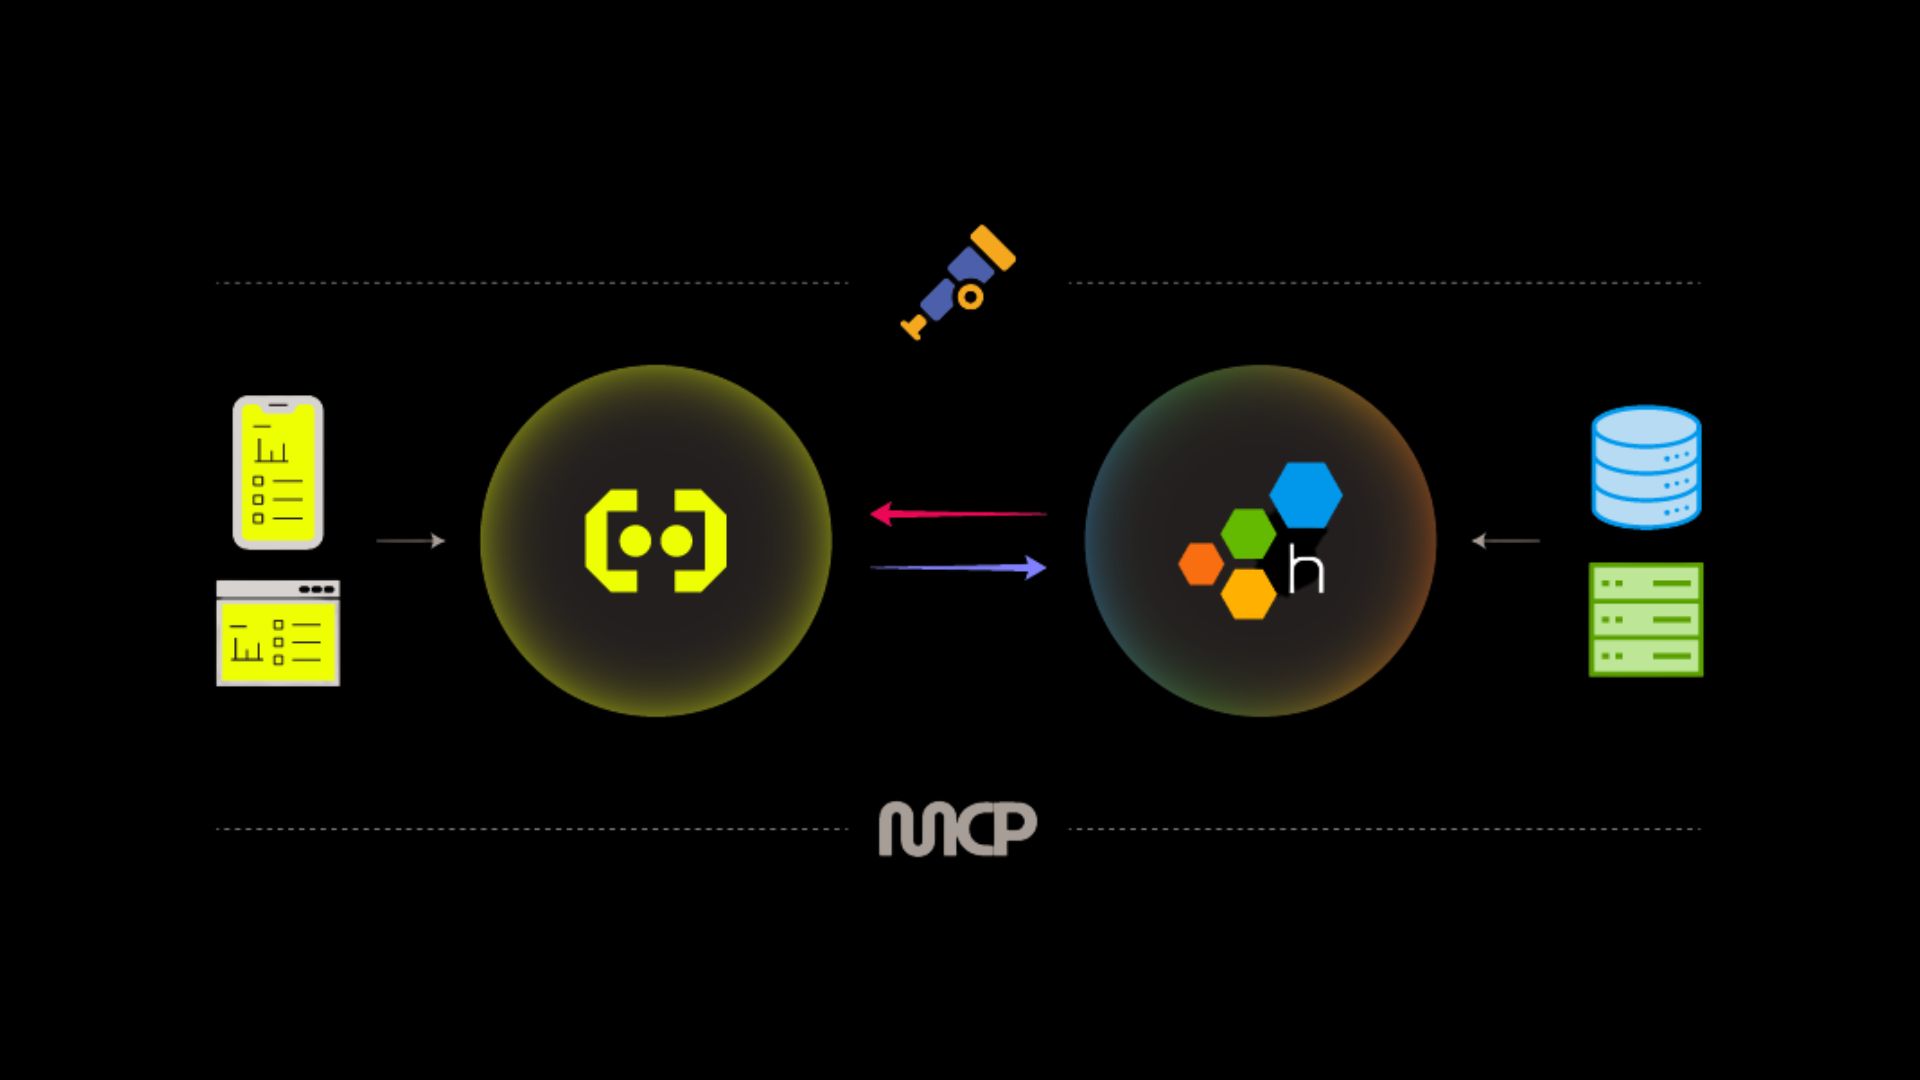
A new strategic partnership with Honeycomb brings Embrace's web and mobile RUM together with industry-leading services observability, so engineering teams can finally follow a problem from the backend straight to the users feeling it.
Explore the top Firebase alternatives for 2022, as we highlight robust backend-as-a-service (BaaS) platforms that offer competitive features, scalability, data management, and real-time functionality, providing developers with viable options to consider for their app development needs
In this article, we’ll clarify what sets monitoring, observability, and telemetry apart, and why a clear grasp of these terms is crucial for building resilient systems.
The mobile app development landscape is fast-paced and challenging. This is why it's so important to equip your mobile team with the best CI/ CD tool. Learn about the top 5 tools in our post.
Explore the top Crashlytics alternatives for 2022, as we highlight robust crash reporting and error monitoring platforms that offer competitive features, scalability, integrations, and actionable insights, providing developers with viable options to effectively track and resolve app crashes for enhanced app performance and user experience.