


Android
Learn how Embrace provides deeper insights to make diagnosing even the most difficult issues, easier.
Android engineers face a unique challenge: device and operating system fragmentation.
The ever-expanding variety of Android devices, vendors, and operating systems versions means there’s only so much you can plan and make assumptions for.
No matter how thoroughly you test your app, there will always be edge cases unaccounted for; edge cases that are often difficult to diagnose and result in crashes that frustrate engineers and users alike.
Edge cases become even more difficult to solve when we add in the complexity of modern mobile apps that can do everything from organize your digital finances to manage your farm’s pest control system.
In the world of Android development, it’s becoming critical to have tooling that goes beyond simple stack traces.
Android engineers need tools that help identify issues faster and provide valuable insights into the root cause of crashes, so they can spend their time where it matters most: building better user experiences.
In this post, we’ve worked with our in-house Android experts to give you a taste of what it’s like to identify and diagnose an edge case with tools built for mobile. Specifically, we’ll show you an example of how you can diagnose memory issues on low-end devices faster with Embrace.
If low-end devices are important to your user base, you’ll want to keep an eye on memory issues as they can wreak havoc on the Android experience. As an Embrace user, all crashes can be monitored through the Crash Page, accessible through the left-hand navigation menu.
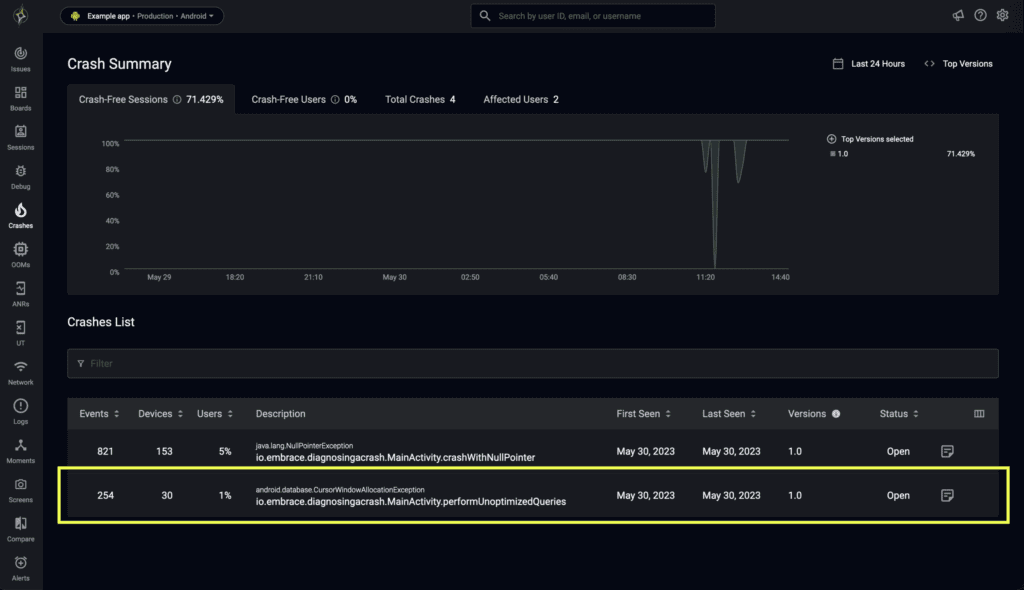
Let’s imagine that once you get to the Crash Page you see a sqlite-related crash that you have not encountered while developing or testing your application. The crash is in the form of a CursorWindowAllocationException.
As shown below, the crash is listed along with important information like the number of events, devices, and users affected, as well as information on when and what app versions the crash was reported in. As you can see, this crash only affects 1% of all users.
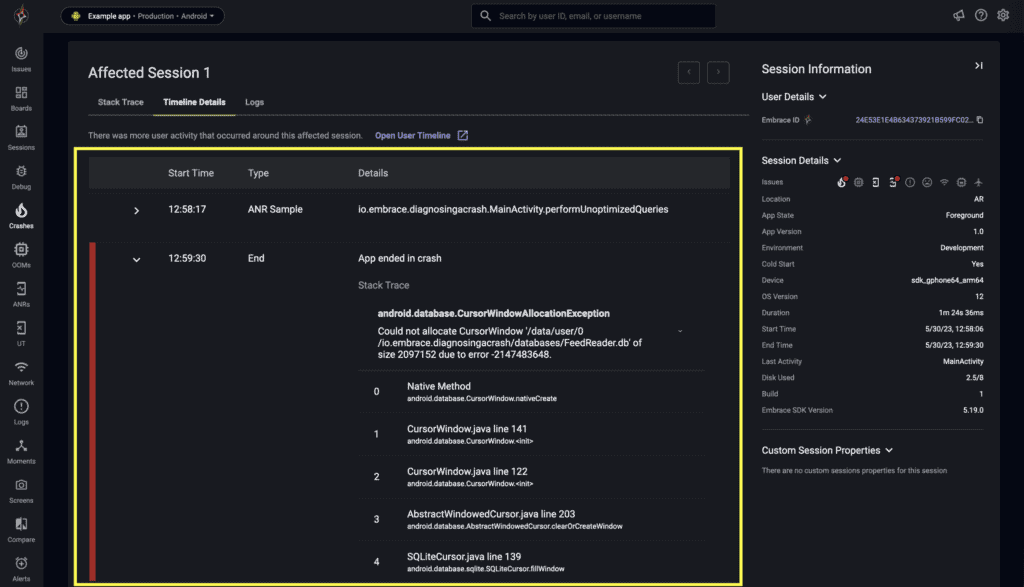
To further investigate the issue, you can go to the crash detail page where you can see a stack trace in the context of a user session. This will give you a good idea of what the user was doing when the crash happened, and provide important contextual clues that will help you diagnose the situation more quickly.
For example, in this case, we can see that the crash happened while an ANR (Application Not Responding) event was taking place.
From this page, you can also take a look at the crash stats. These will let you see in which devices and what OS versions the crash is happening. In our example, we can see that the crash is happening mostly on low-end devices such as the Motorola e5 play and the TCL 403, and on devices running older versions of Android.
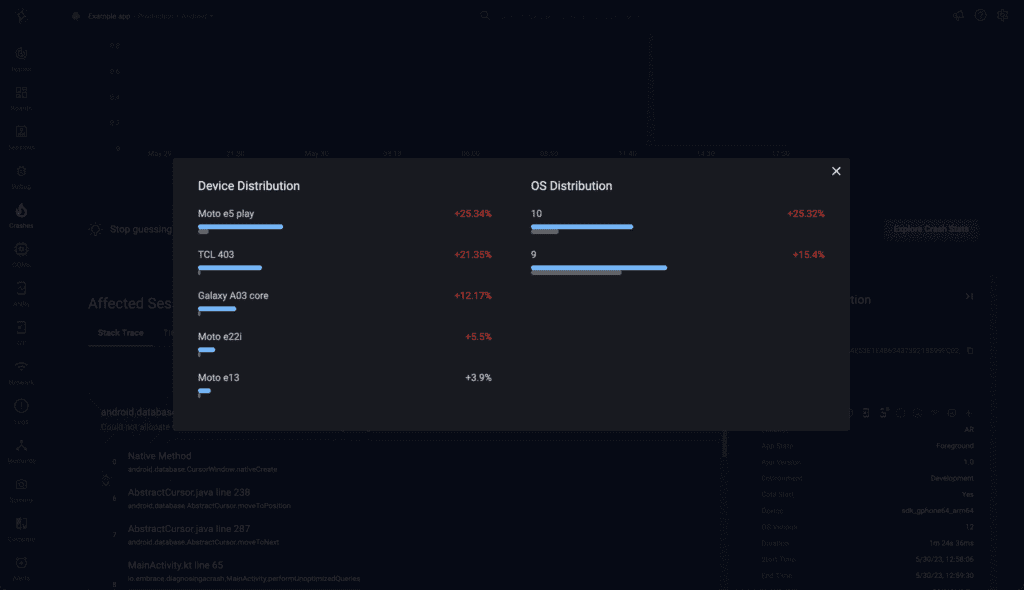
The insights gained from Embrace show that the crash is caused by performance problems in devices with less capable hardware.
In effect, a CursorWindowAllocationException is caused by a lack of available memory when trying to allocate a database buffer. These memory shortages are much more common in low-end devices and may be harder to reproduce in newer hardware. If you look at the user sessions for these users, you will probably notice ANRs as the device struggles to run the application.
Armed with the information of when and why the crash happens, you can set up to fix it.
In this case, the solution may be as simple as batching together operations in a transaction to minimize the number of cursors used, or a more general reduction of memory usage from the application (check, for example, if you are decoding into memory bitmaps that are too big for the resolution of the device).
Together with the fix, you can also add contextual information to some other operations that may cause problems on low-end hardware, using breadcrumbs and moments.
Once you release a new version, you can monitor that crash by setting it as Resolved in the crash page.

Shipping a successful app is a two-part battle. First you need to build a great experience. But equally important is optimizing and maintaining it.
Embrace provides tools that make the second part of that equation as easy as possible, so you can spend more time on the first. By combining intelligent crash reporting with deep user context, we’ve built a platform that helps you identify, prioritize, and resolve any crash, no matter how unique.
Learn more and get started for free, here.

