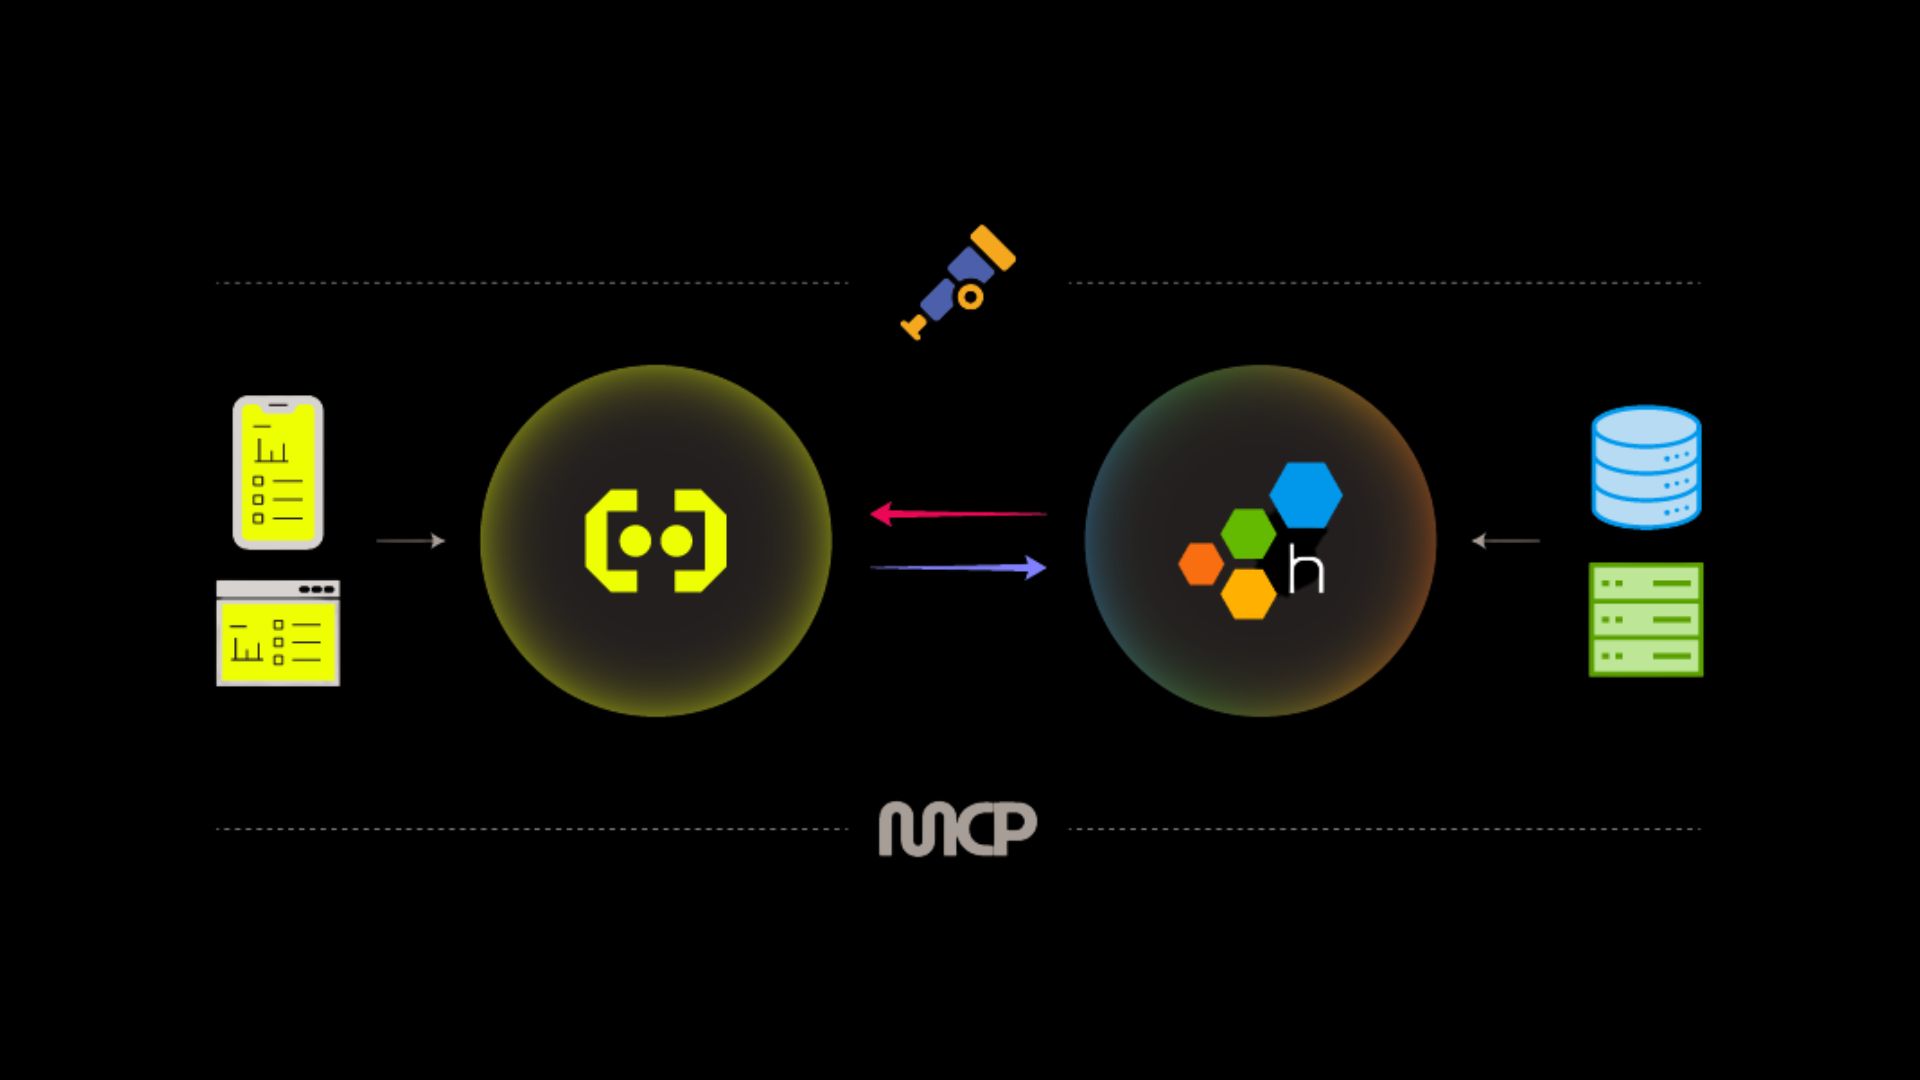
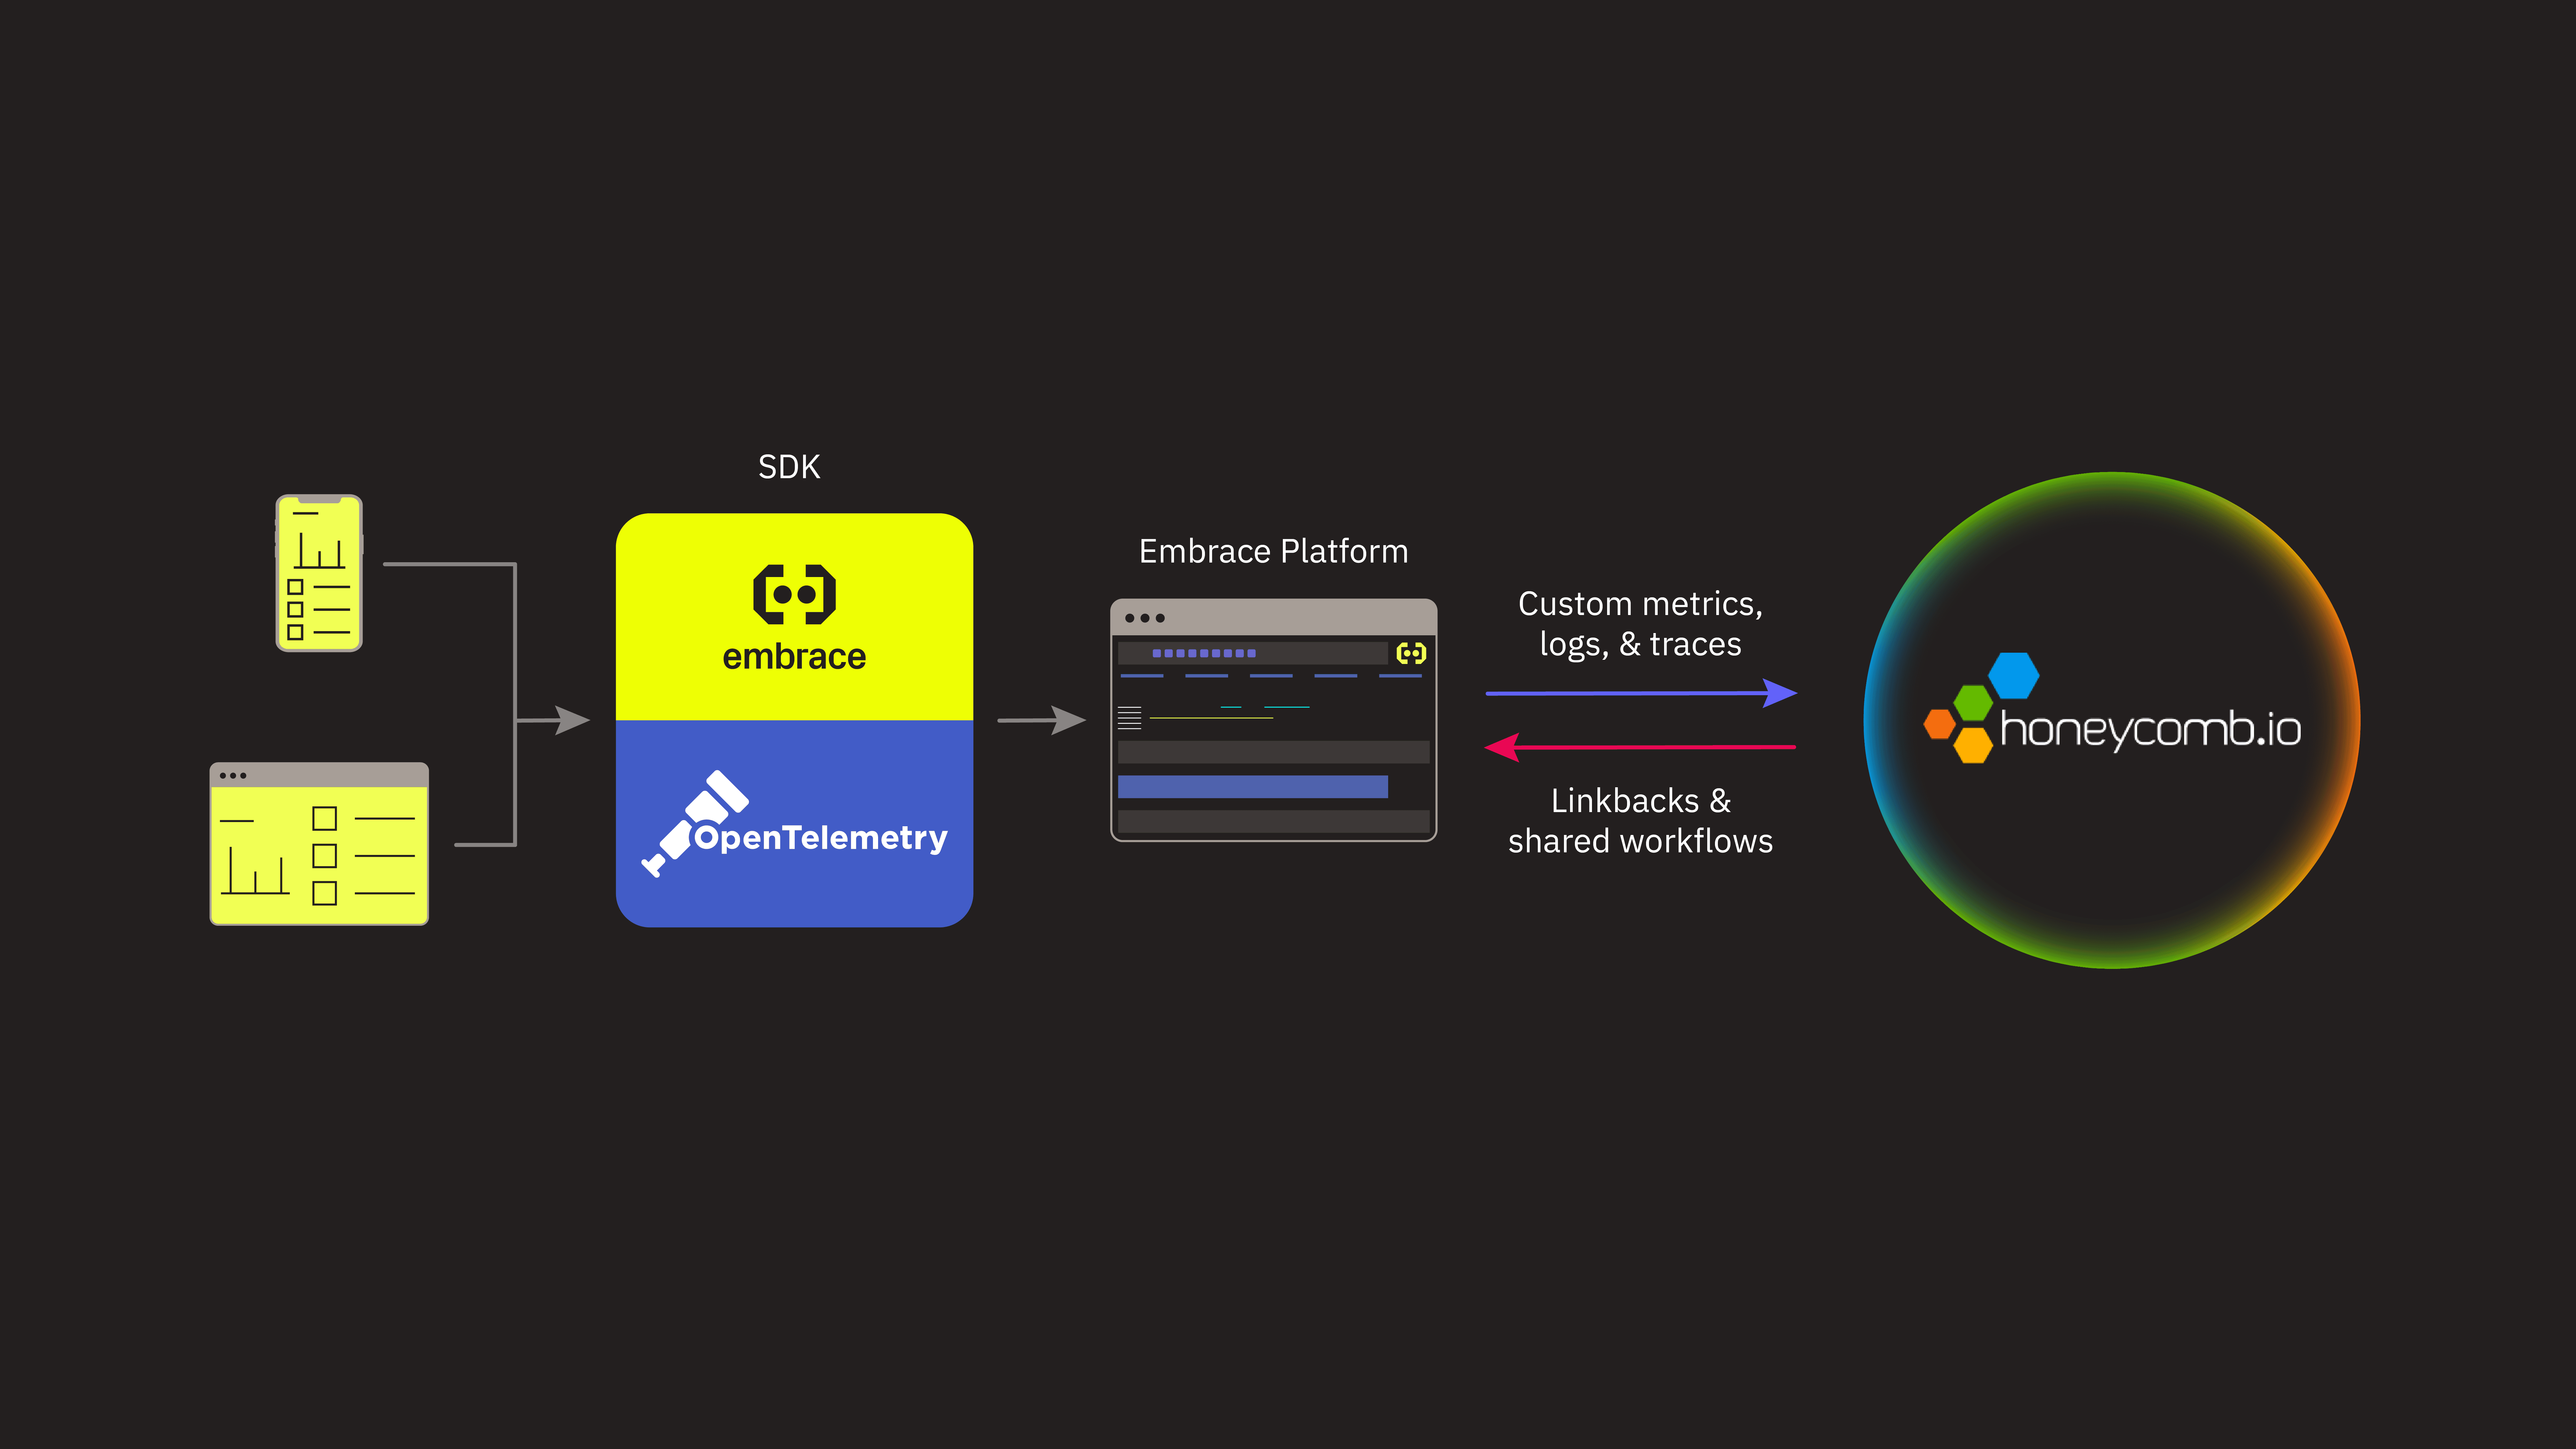
A new strategic partnership with Honeycomb brings Embrace's web and mobile RUM together with industry-leading services observability, so engineering teams can finally follow a problem from the backend straight to the users feeling it.
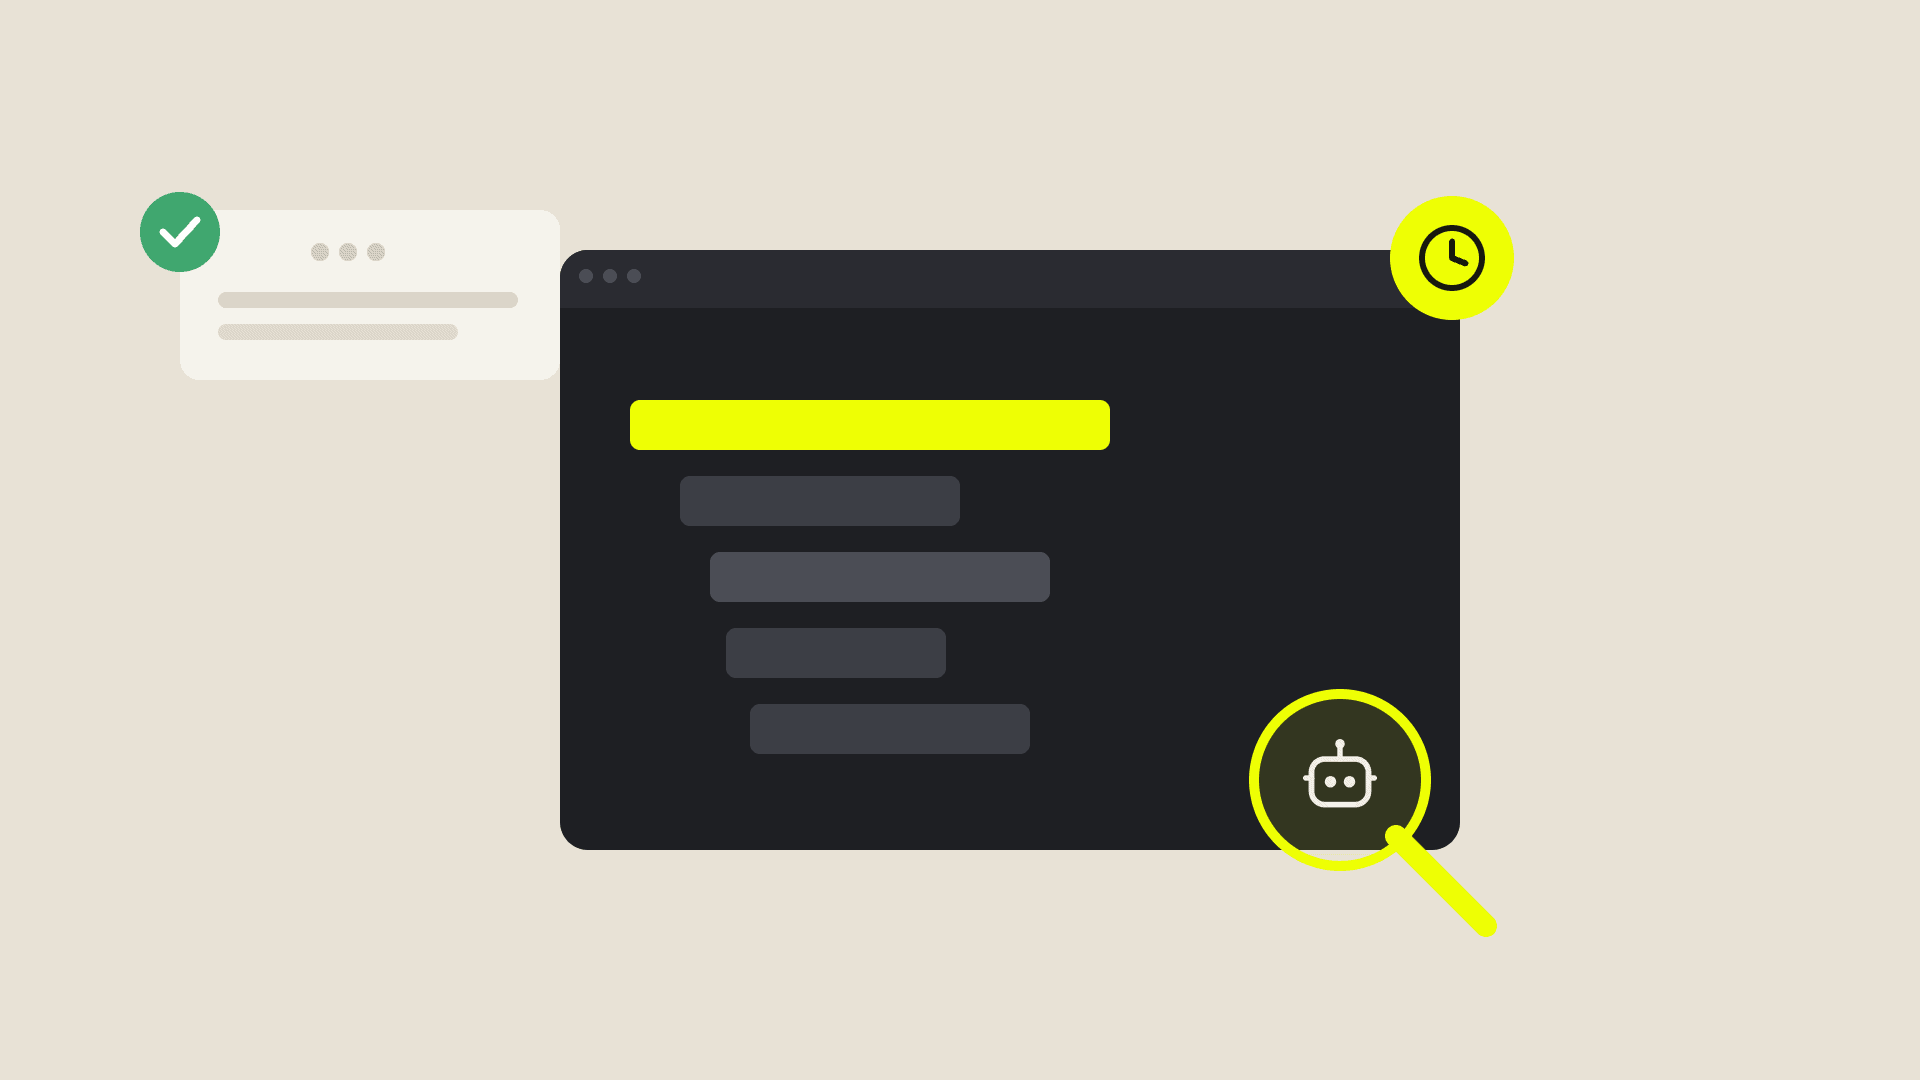
The larger AI landscape moves ever faster, and the same is true for innovation at Embrace. We launched the Embrace MCP Server in beta just over a month ago, and the feedback from customers has been incredible. We love hearing about all the different ways you’re incorporating Embrace data into your AI workflows, so keep that feedback coming!
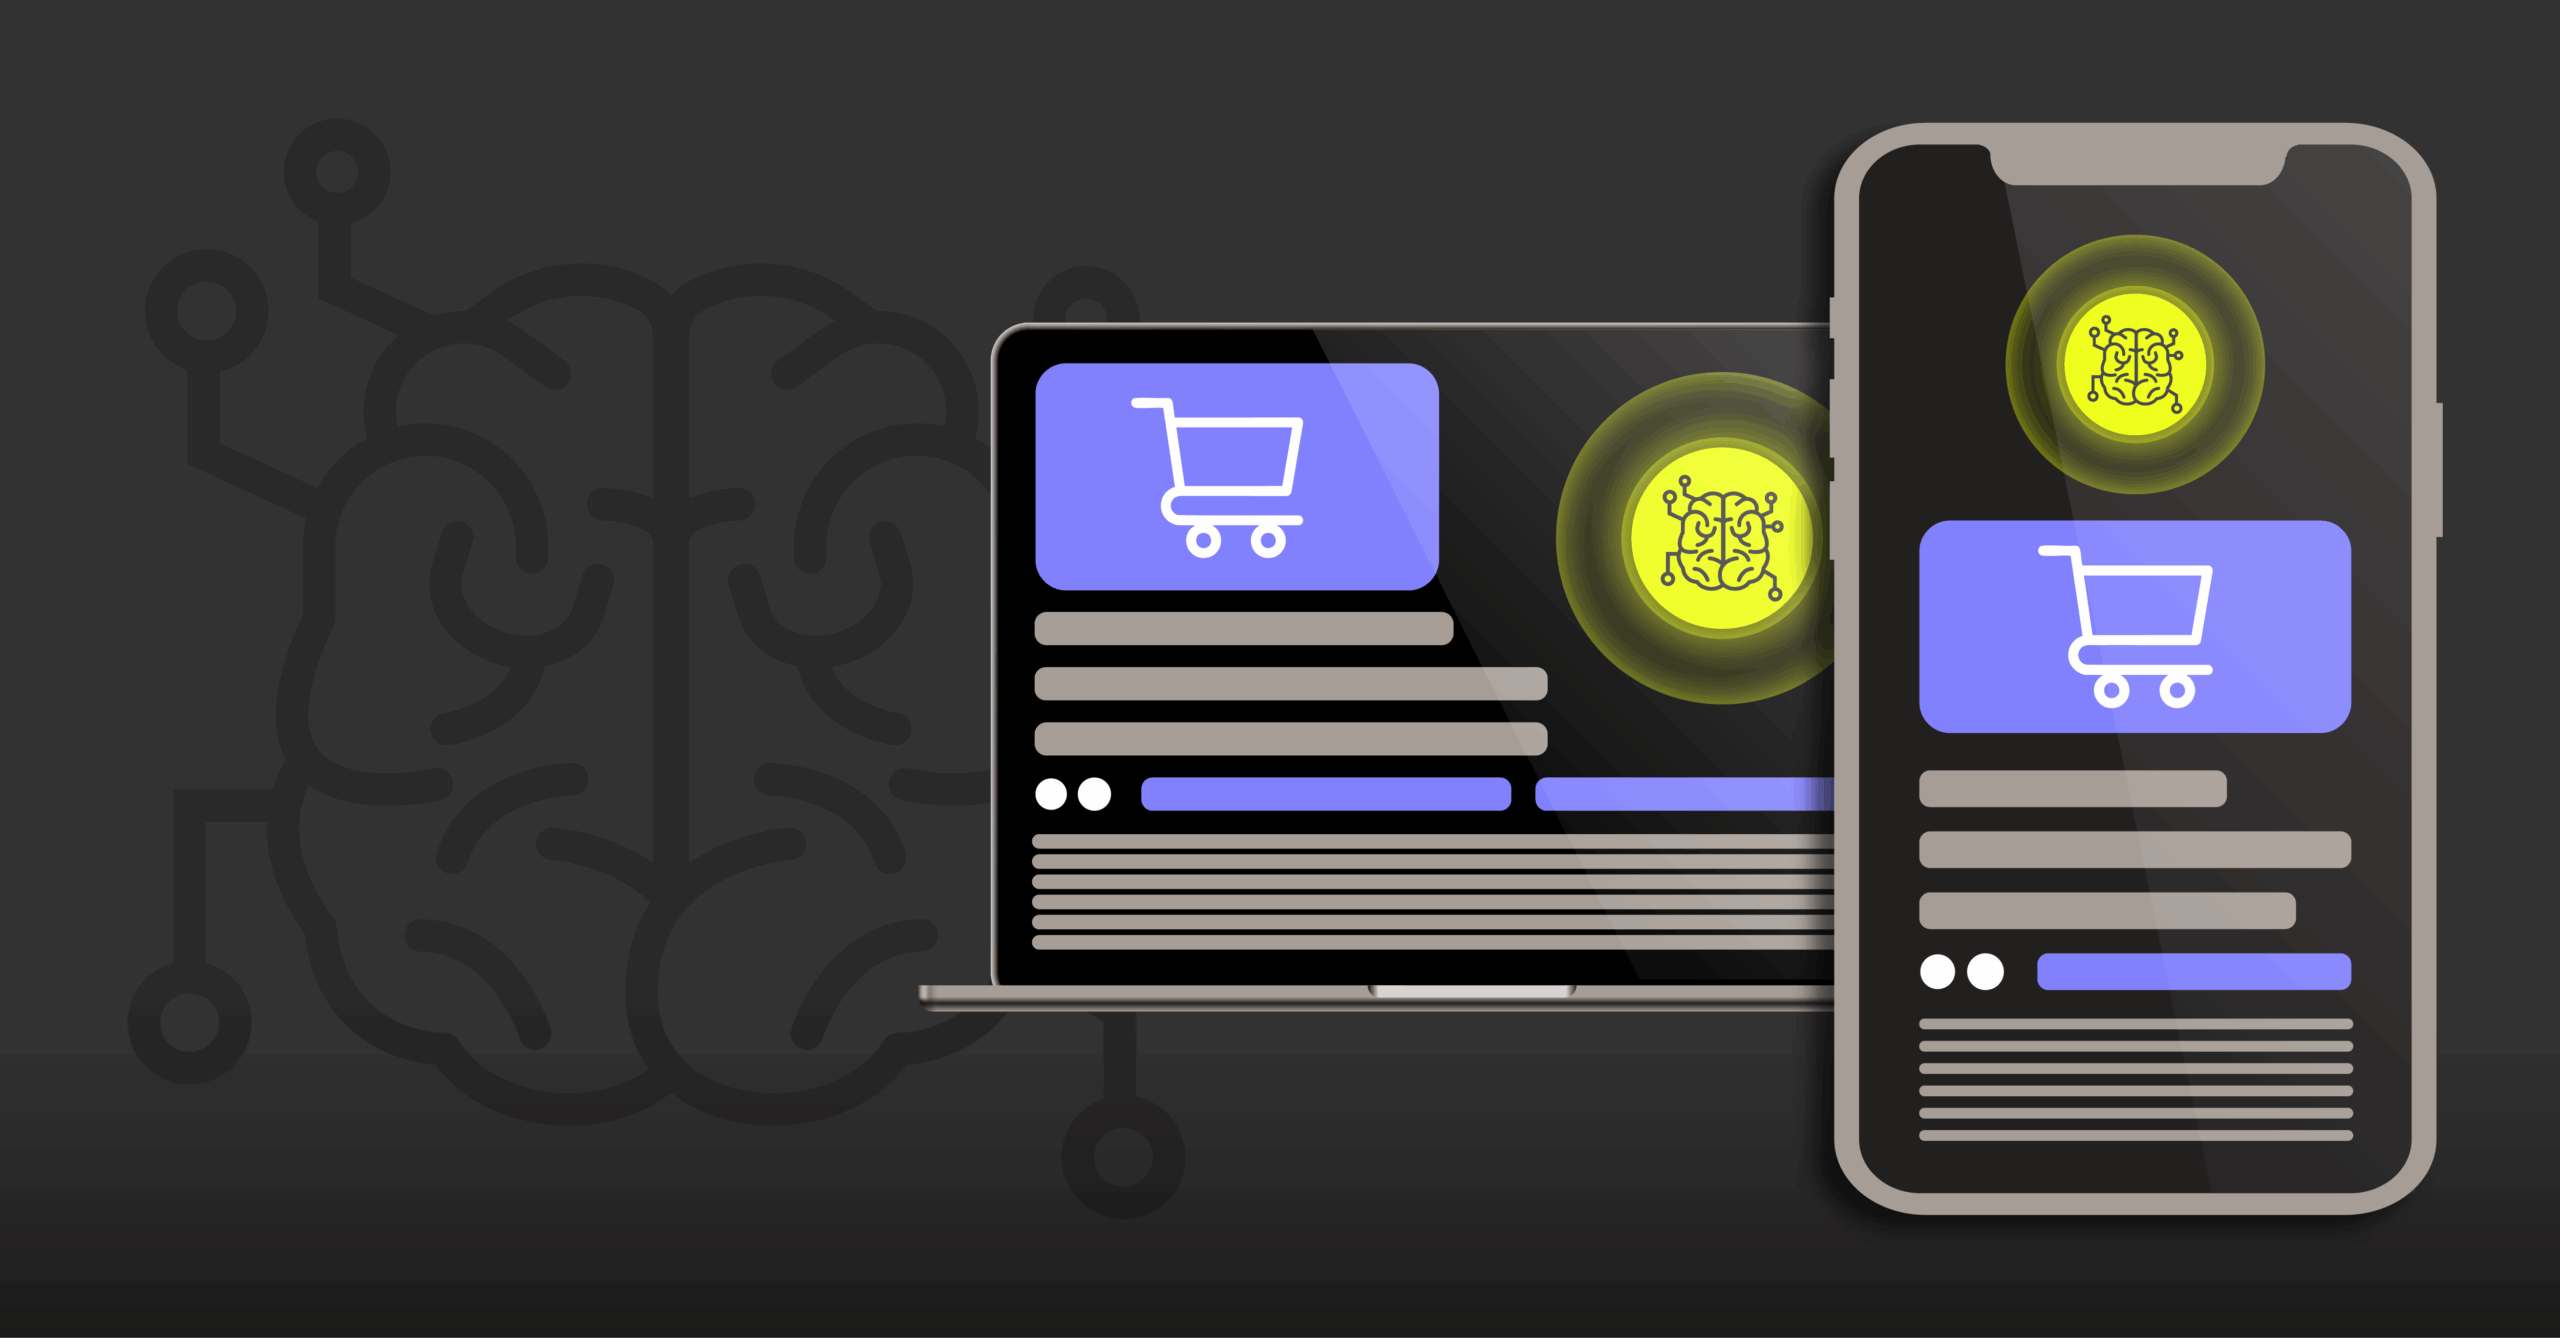
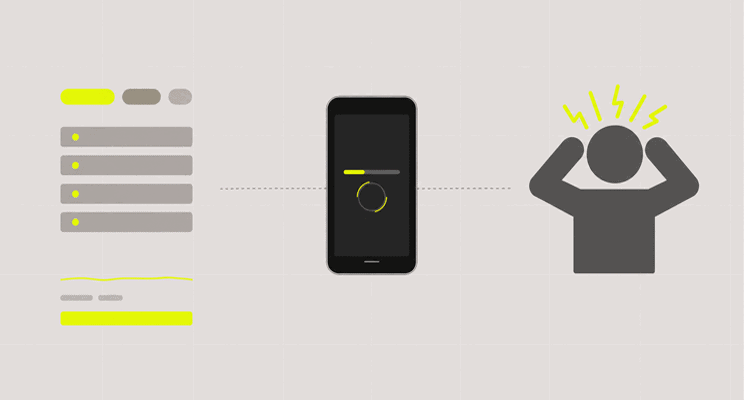
I studied Core Web Vitals data for ten leading online retailers. The results challenge our assumptions about performance: "good" for Google may not be good enough for your users or your business.
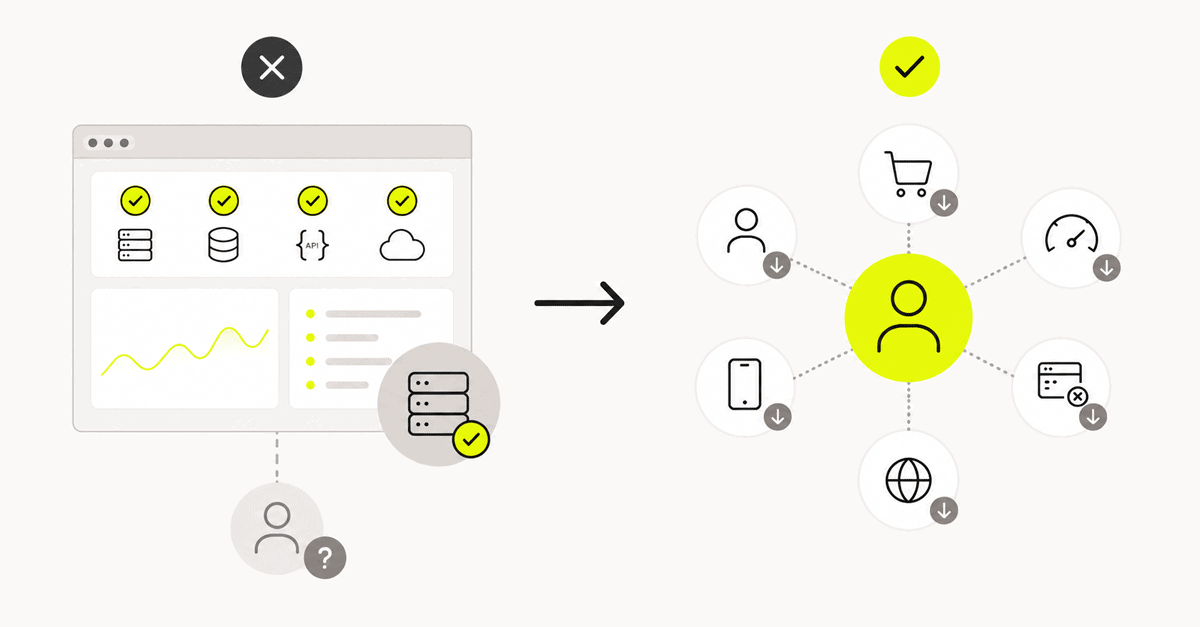
Ever watched your backend team, mobile team, and web team all investigate the same issue from three different dashboards? Then you already know the problem that OpenTelemetry solves. If you need an easy-to-understand explainer to share with folks who are new to OTel, this is for you.
With Embrace and Honeycomb, you can connect user sessions to backend traces, so every investigation carries its evidence across the stack, not just to its edge.
Ask an SRE what "reliability" means and you'll get a pretty consistent answer. It means uptime, latency SLOs, error budgets, on-call rotations, and someone's pager going off during a dinner party. (I know, no one carries pagers any more. I’m just enjoying an anachronistic moment.)
None of that is wrong. But it's incomplete, and that incompleteness may be hurting your users and your business.
We surveyed 300 frontend engineering teams. 89% use AI in their workflows, but only 8% apply it to observability. See what drives the gap and how your team compares.
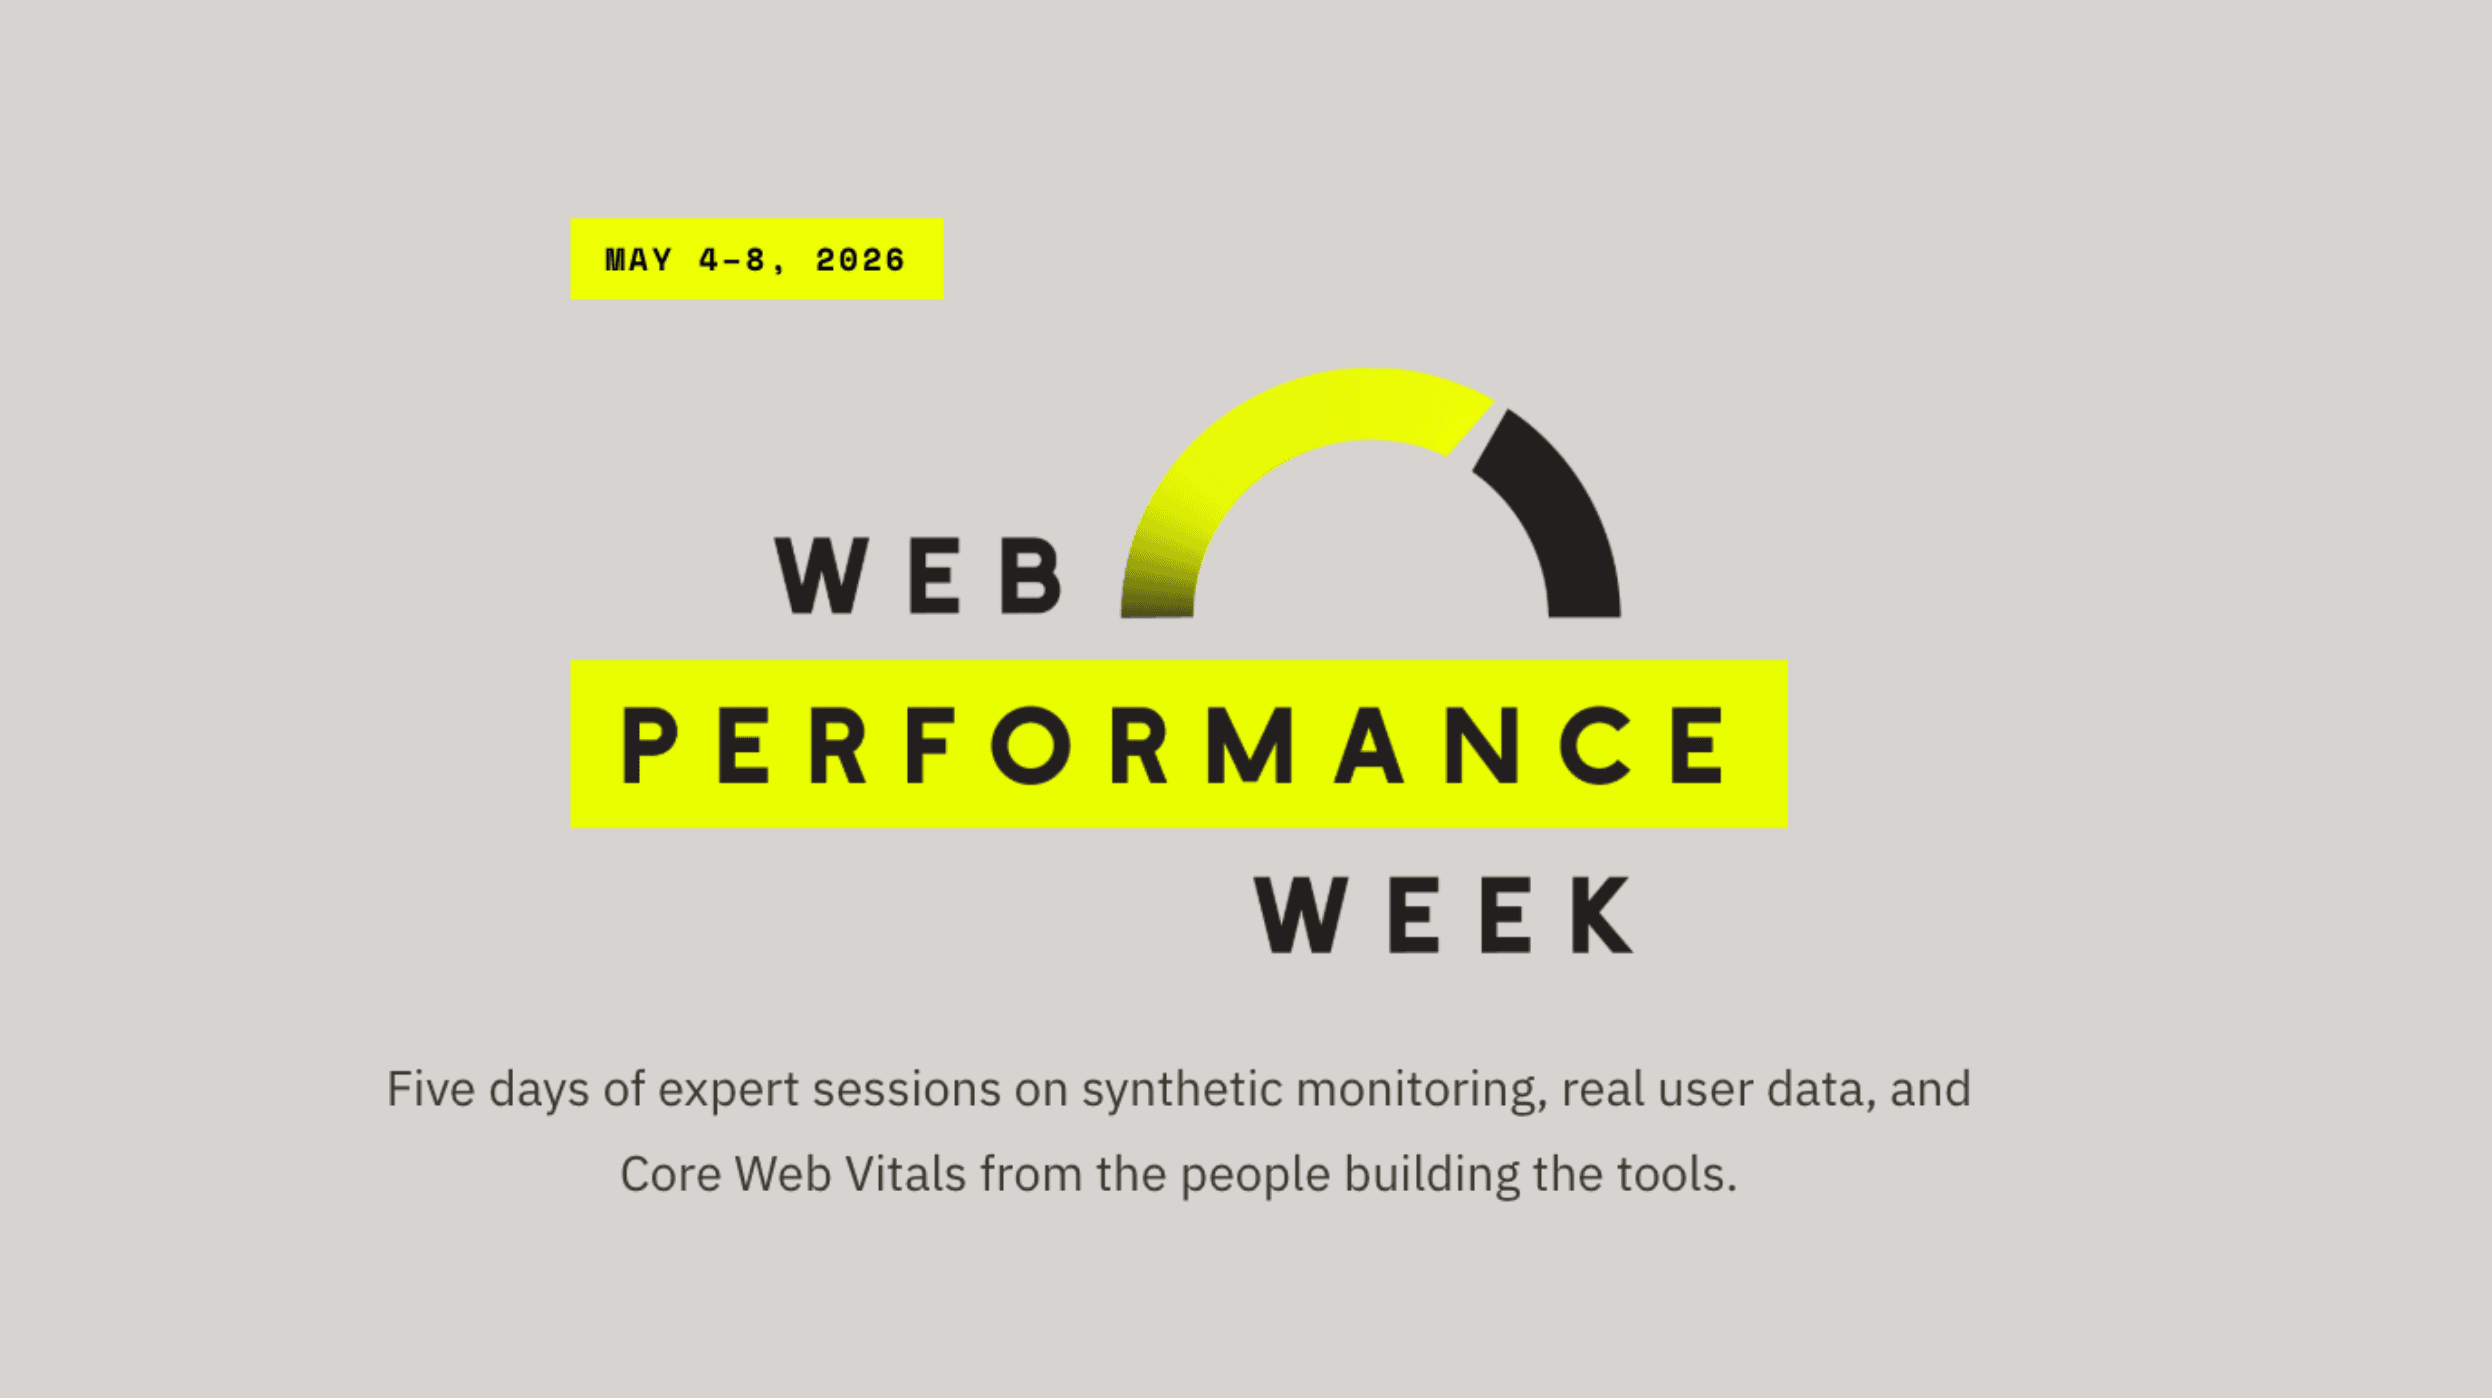
Get these fundamentals right and synthetic monitoring stops being a dashboard you check occasionally and becomes an early warning system that catches performance issues before they hit your users.
Embrace Synthetic Monitoring is here. It gives web performance teams controlled, repeatable tests for catching regressions, validating optimizations, and benchmarking against the sites they're competing with, all alongside the real user data already in Embrace.
Core Web Vitals transformed how entire organizations think and talk about web performance. Mobile deserves an equivalent framework — one that's rigorous, user-focused, and tied to real business outcomes. We're building it. Here's how.
The golden signals are not wrong, but they only tell you server-side health. You need user-focused observability to tell you whether users are succeeding.