Observability teams often ask why we don’t show monolithic traces for issues like slow startups. While they theoretically reveal all services involved, they’re hard to interpret, and distract from what’s critical: the mobile experience context.
Contribution continues Embrace’s investment in vendor-agnostic, open-source instrumentation in frontend and mobile by extending support to Kotlin and Kotlin Multiplatform
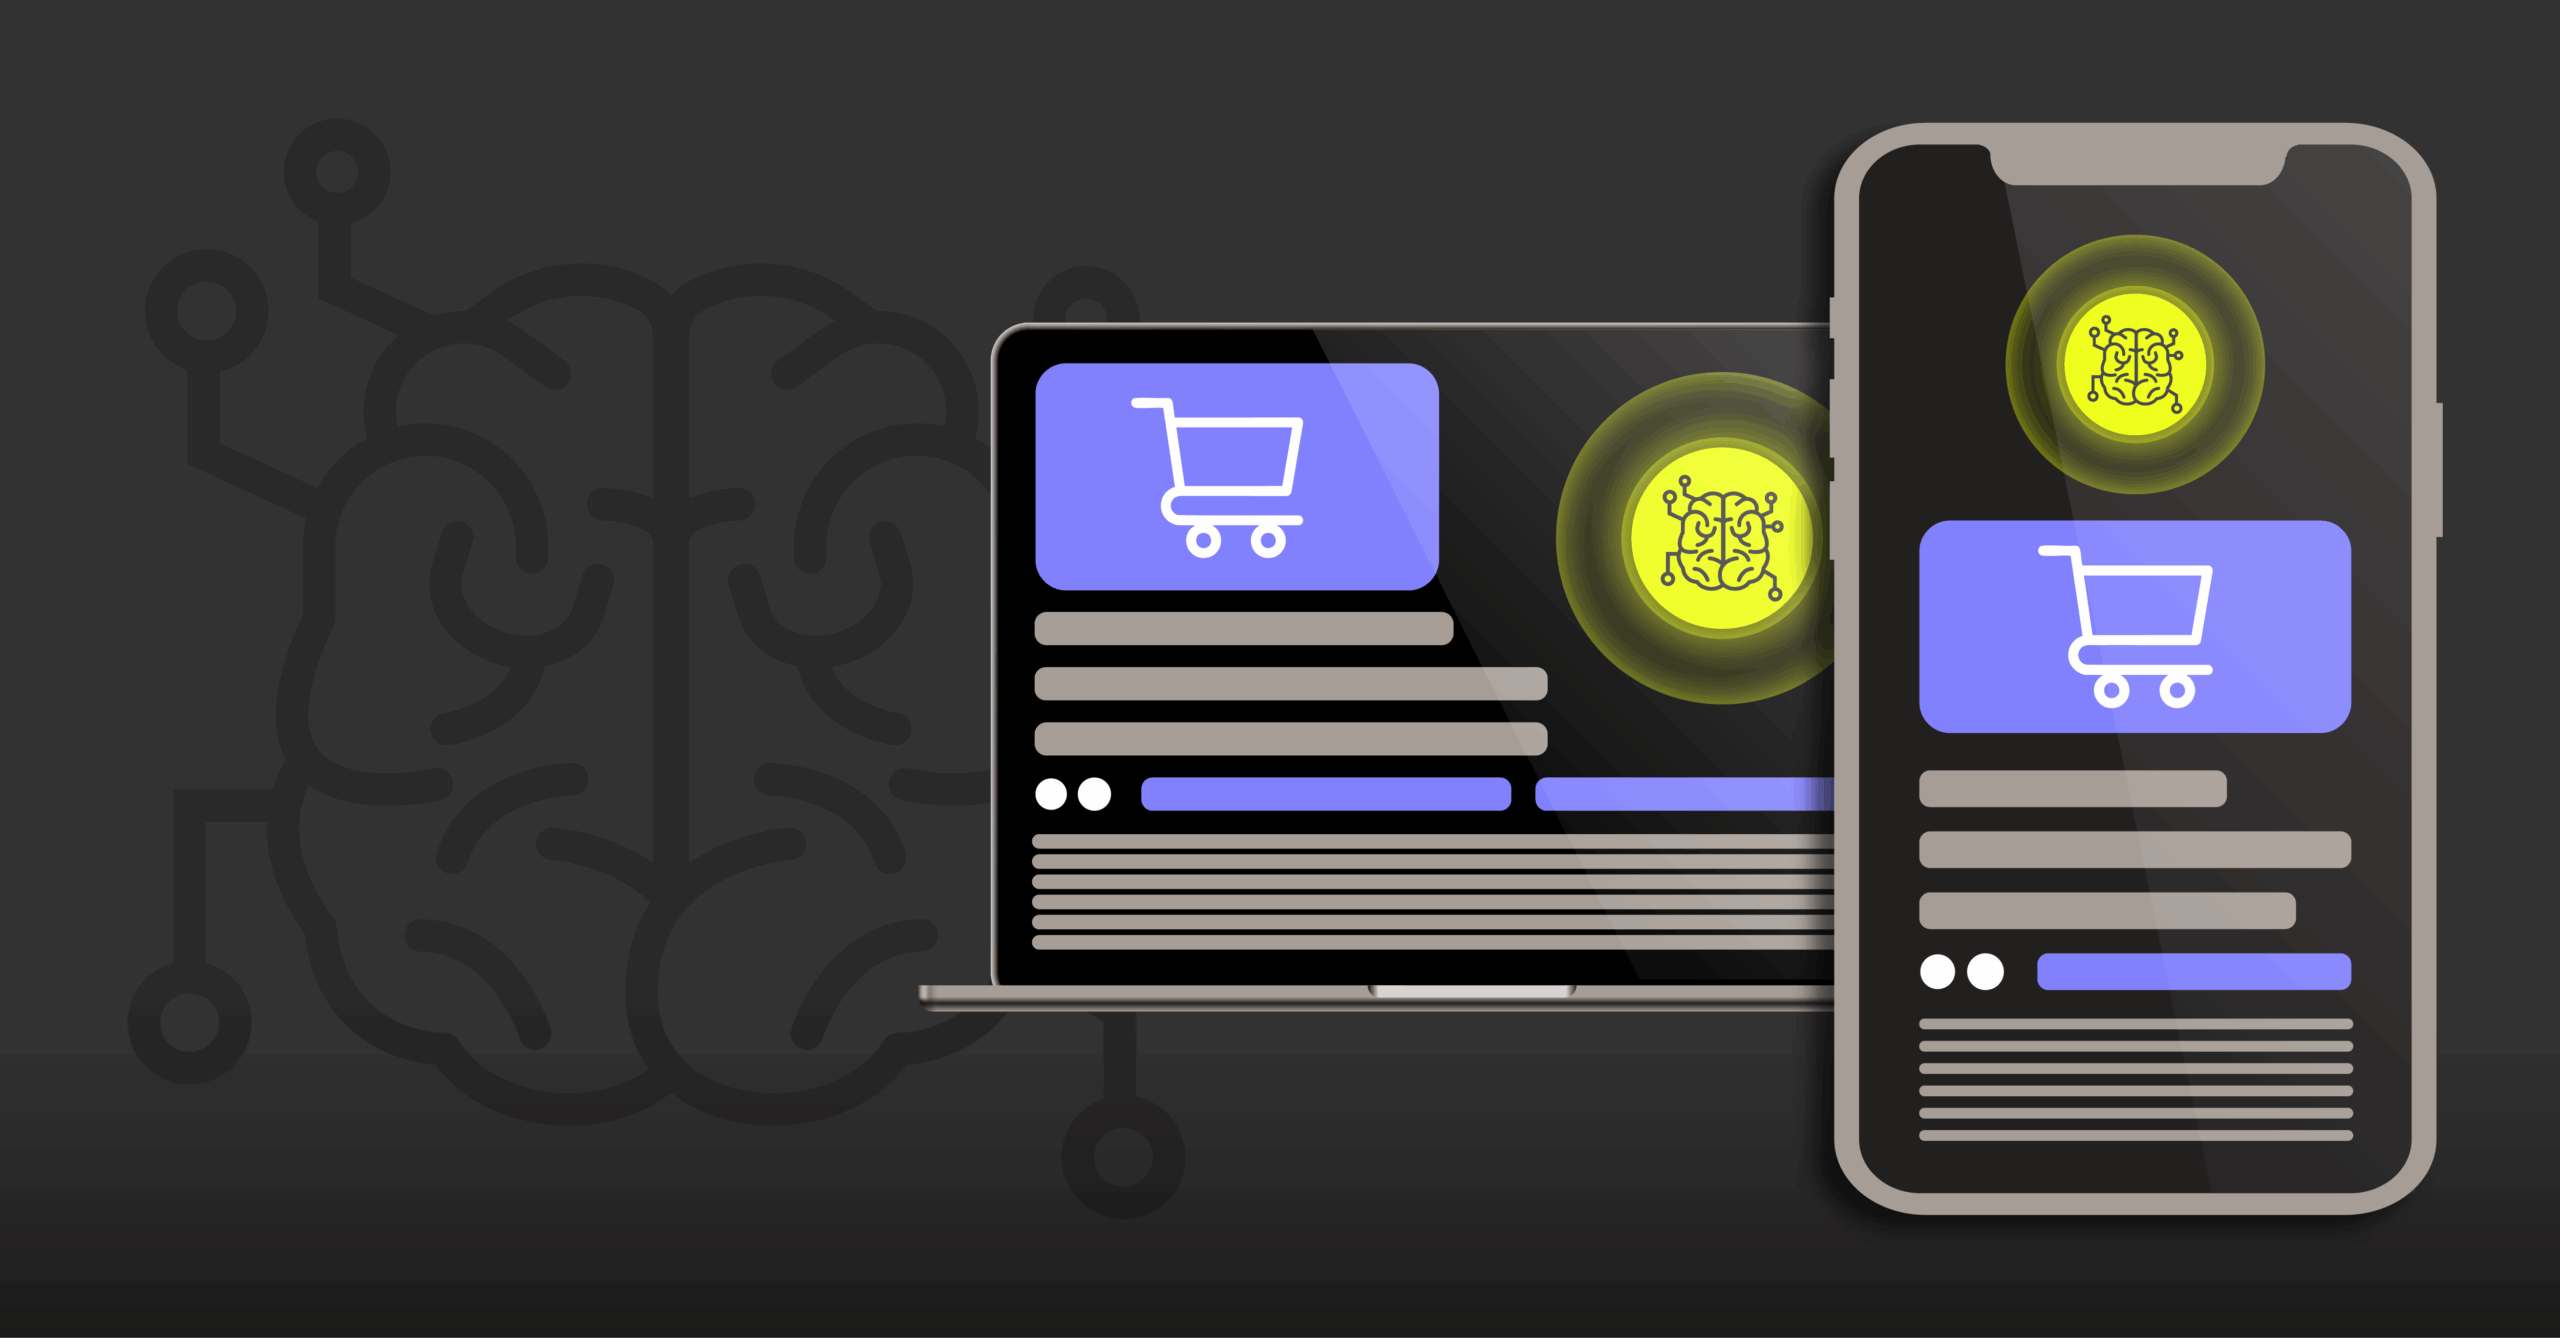
The larger AI landscape moves ever faster, and the same is true for innovation at Embrace. We launched the Embrace MCP Server in beta just over a month ago, and the feedback from customers has been incredible. We love hearing about all the different ways you’re incorporating Embrace data into your AI workflows, so keep that feedback coming!
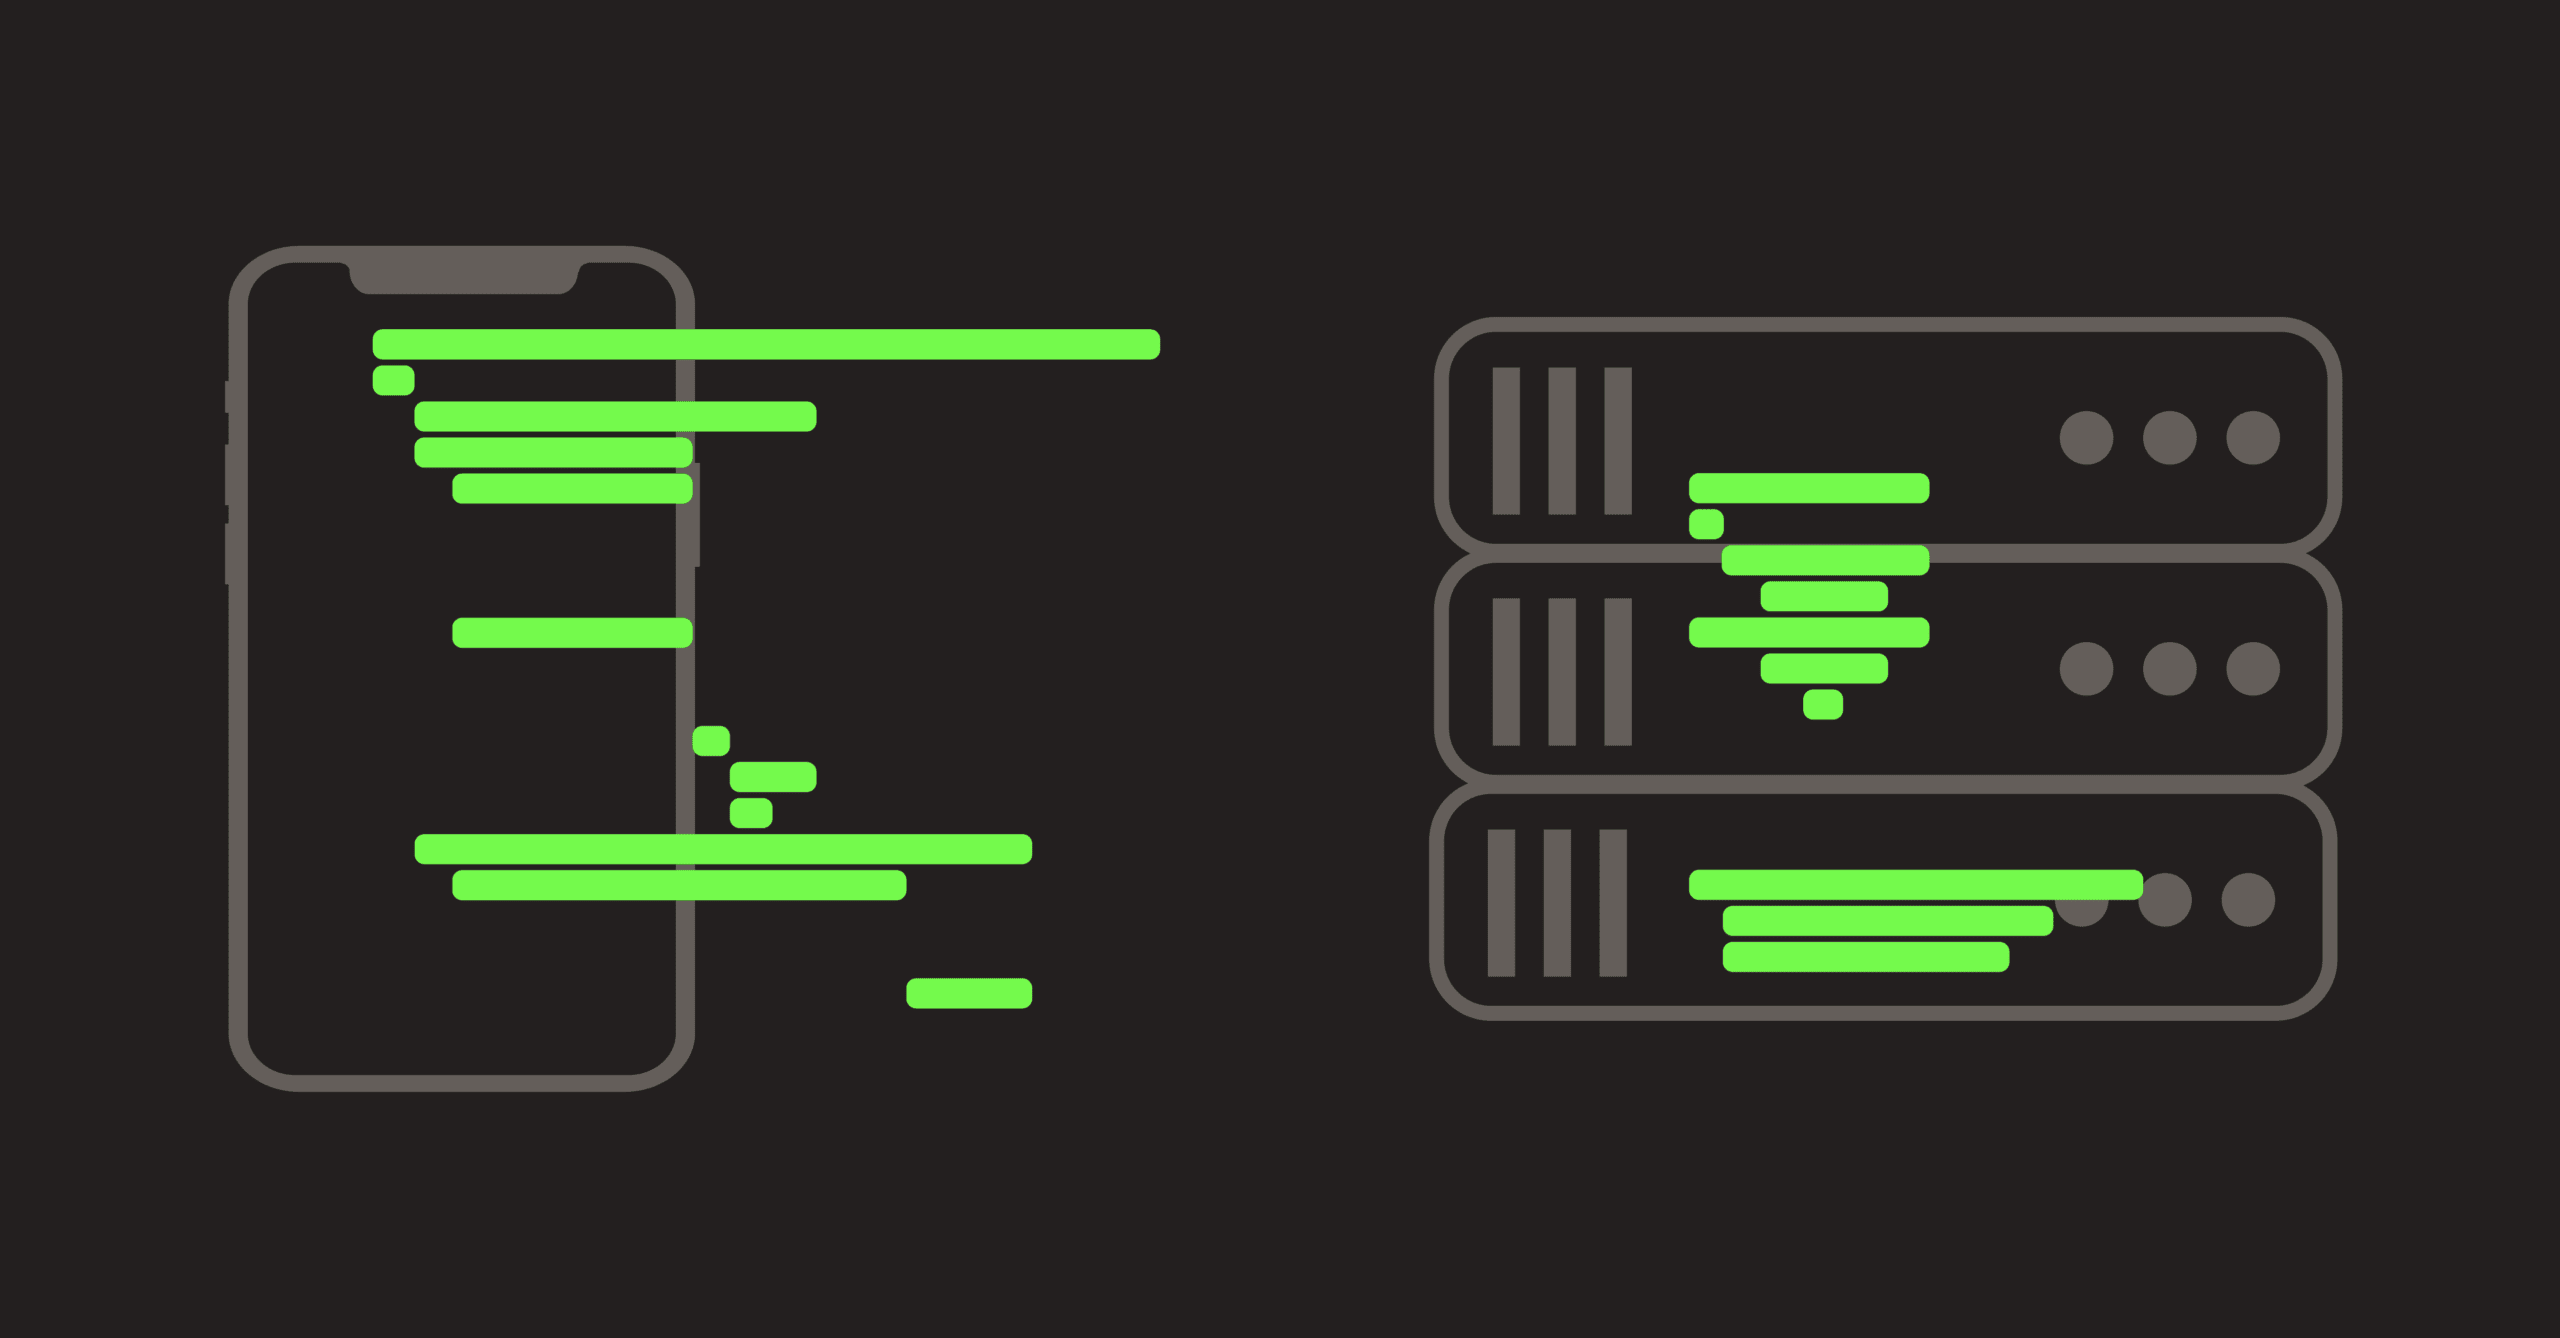
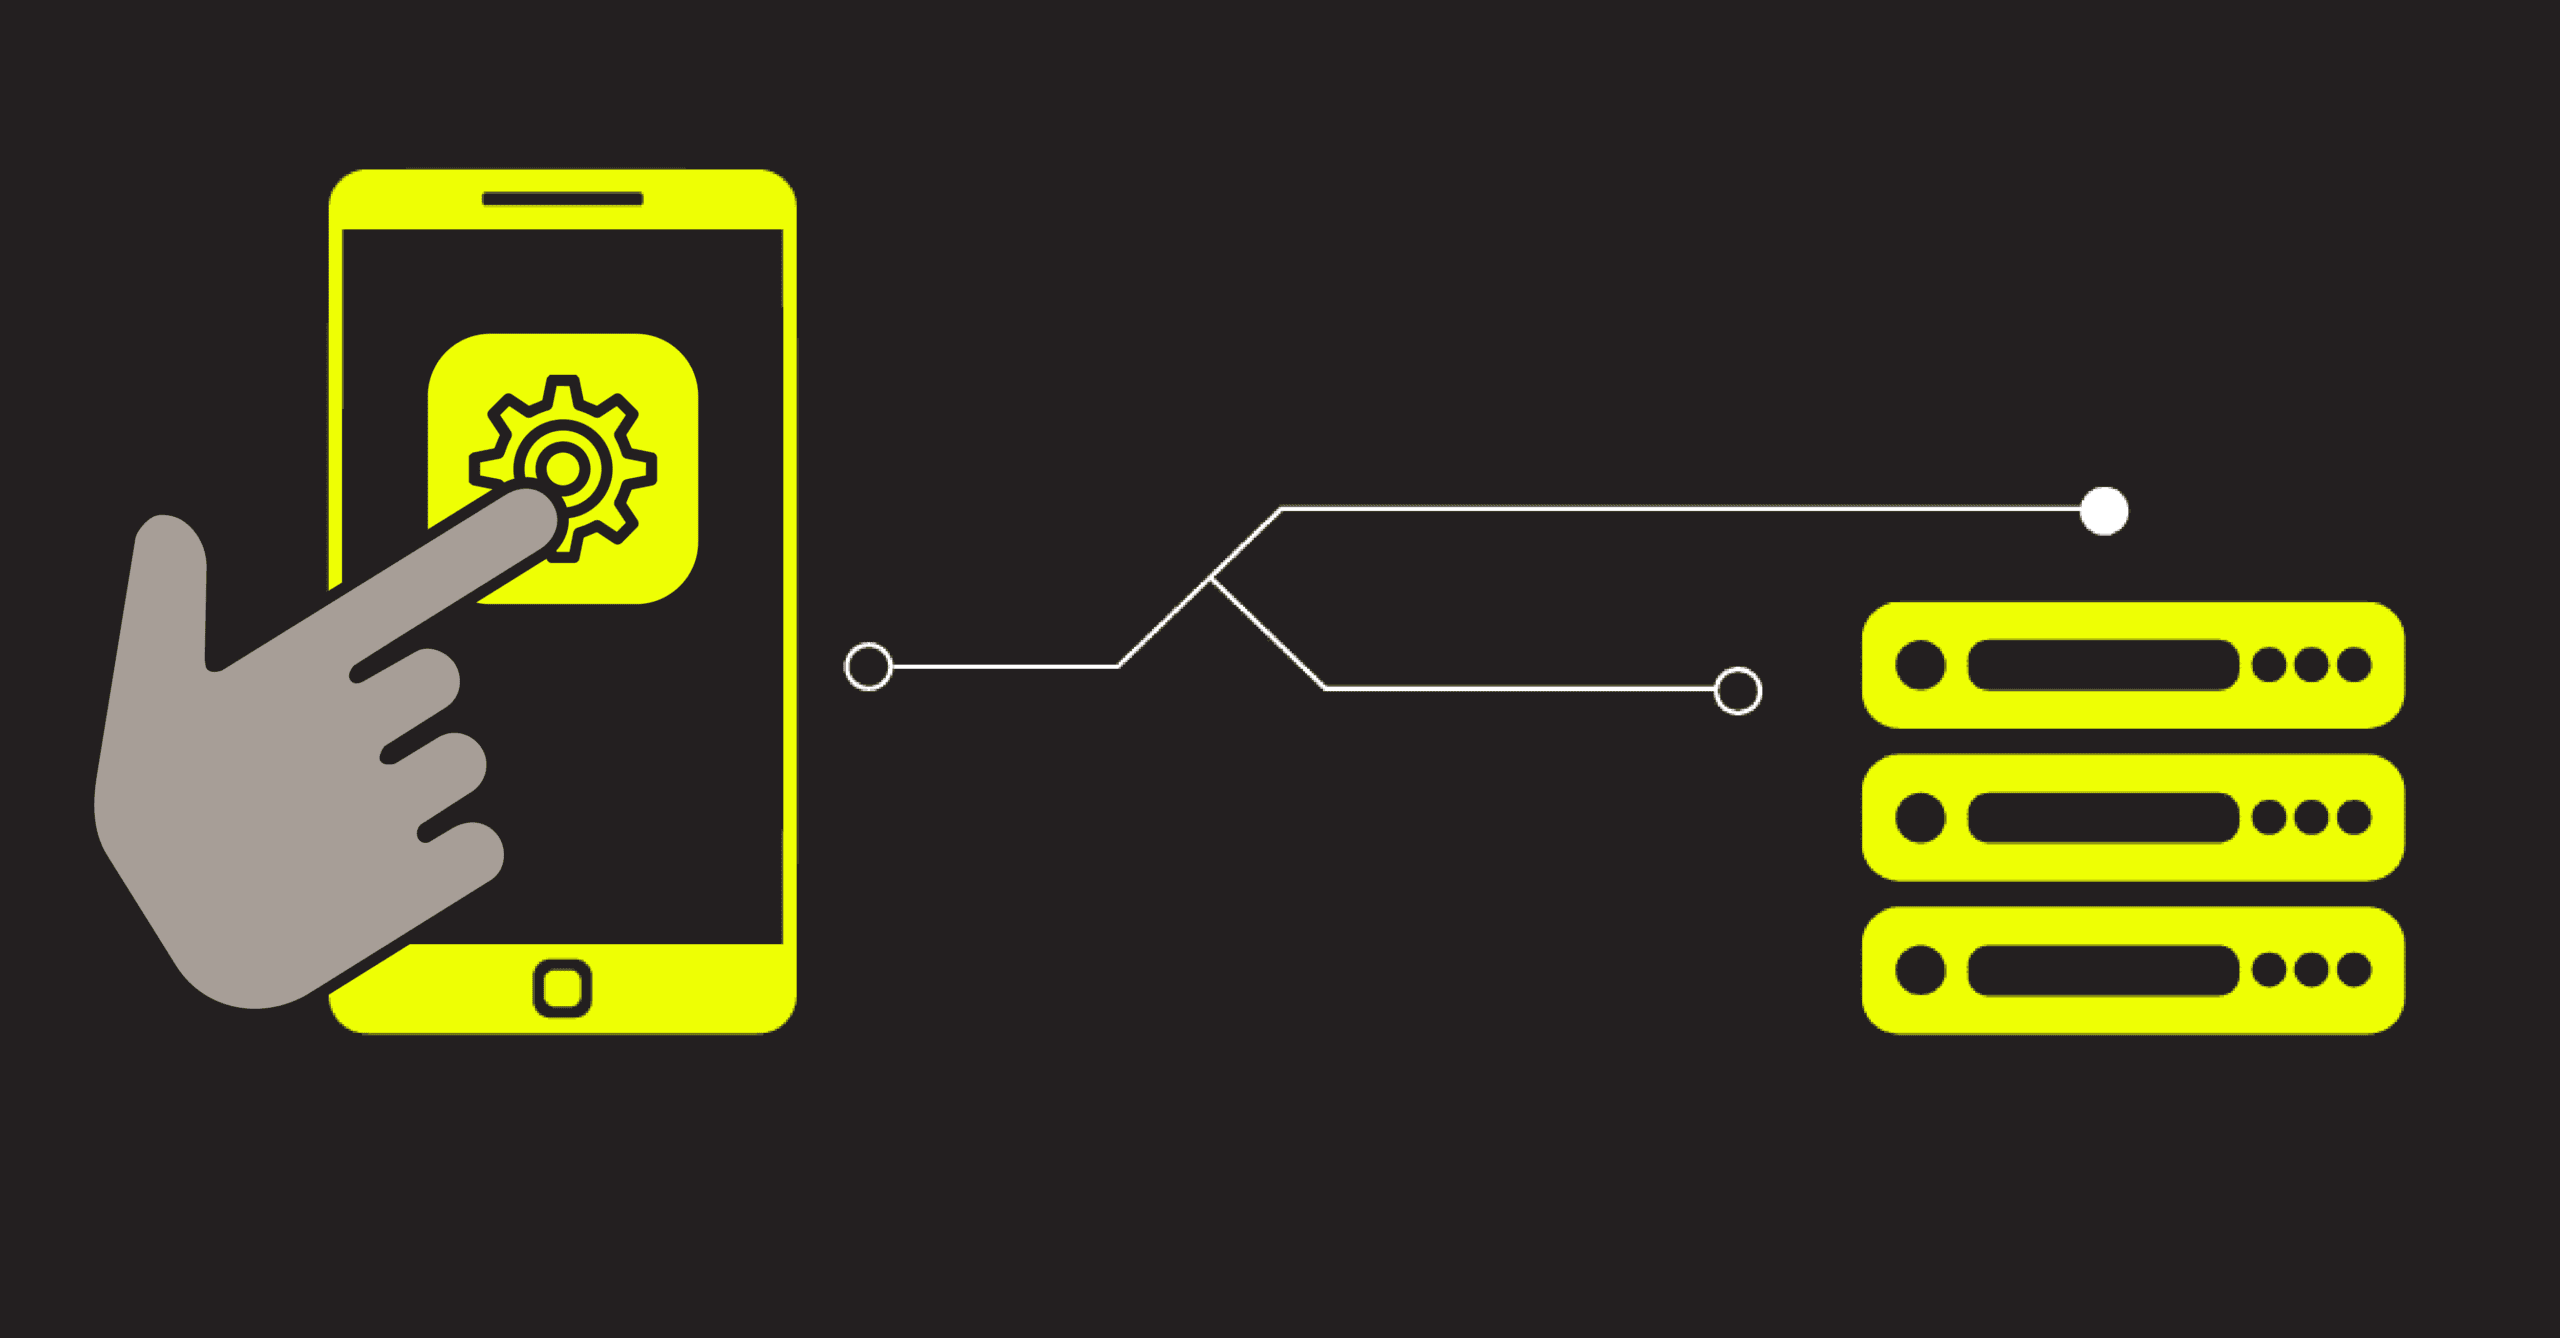
With Network Spans Forwarding in Embrace, you're only a click away from connecting client-side network requests to your backend observability platforms.
KPIs tell you that something changed, but rarely why. When revenue, conversion, or payments dip, engineering teams are expected to respond fast—yet most lack the technical clarity to explain what actually broke. This article explores why KPI conversations stall, how to translate business metrics into real user journeys, and where to go deeper when you need answers.