Users force quit mobile apps for many reasons. While some do so out of habit, many do so to end a particularly frustrating user experience. As such, knowing why user terminations happen can open up optimization opportunities that you may have been previously blind to.
With Embrace, mobile teams have full session context for every user experience, which provides a wealth of diagnostic information to identify and prioritize the root cause of your user terminations. This post will cover why it’s crucial to monitor your user terminations and how mobile teams can use Embrace to minimize their impact on revenue, retention, and engagement.
Why is it important to monitor user terminations?
A user termination occurs when a user fully exits out of your app through force quitting. While user terminations are not necessarily bad, there are many reasons why they could indicate a frustrating user experience. Broadly, there are four main types of negative session-ending outcomes in mobile:
- Crash – The app experienced a fatal code exception.
- Memory leaks – The app exceeded memory limits.
- ANR – The app went into a frozen state that it couldn’t recover from.
- User termination – The user quit the app.
The first three outcomes have known root causes. If you investigate the entire user session, you can easily track down what went wrong because mobile monitoring solutions capture specific data for remediating them. User terminations, on the other hand, are an avenue to surface a broader range of failure types that lead to a frustrating user experience. Because they are a user action and as such have no specific failure associated with them, some examples of this include:
- Broken UI elements
- Dead-end states
- Missing assets like images
- Problems loading or scrolling through list screens
- Blank webviews
- Slowdowns that don’t trigger an ANR
- Any number of other unforeseen technical issues
Tracking user terminations allows your team to proactively surface regressions in many ways, including:
- New features – You may release a new feature that causes a spike in user terminations on screens that could indicate a poor UX within said feature.
- New versions – You may release a new version and notice a spike in user terminations on a particular OS that could indicate an incompatibility issue with the newly introduced code.
- New markets – You may launch into a new market and have a spike in user terminations that could indicate device or connectivity differences that may cause negative user experiences.
In other words, monitoring your user termination rate is a great way to surface problems that users are experiencing but may not be reporting to you.
How to identify spikes in user terminations with Embrace
With Embrace, you don’t have to wait until users complain to know when you have a problem. Instead, you can proactively address issues. Teams can create alerts to be notified of regressions in performance, stability, and health metrics, including user terminations. In addition, they can track user terminations over time with custom real-time dashboards.
While event-based monitoring solutions rely on sending crash reports and error logs, Embrace can highlight powerful patterns across entire user experiences, which lets you hone in on the root cause of performance and stability problems that span beyond a single network call or line of code.
We’ll now dive into how Embrace provides best-in-class visibility into user terminations.
View aggregate metrics with Embrace’s User Terminated Summary page
The User Terminated Summary page provides aggregate data about when users force quit your mobile application. Monitoring this metric is helpful for understanding which features and releases may have introduced regressions that cause users to abandon slow, frozen, or frustrating areas. This feature is beneficial because mobile teams can:
- Spot differences in user terminations across releases.
- See the impact of user terminations across users and sessions.
- Track user termination patterns over time.
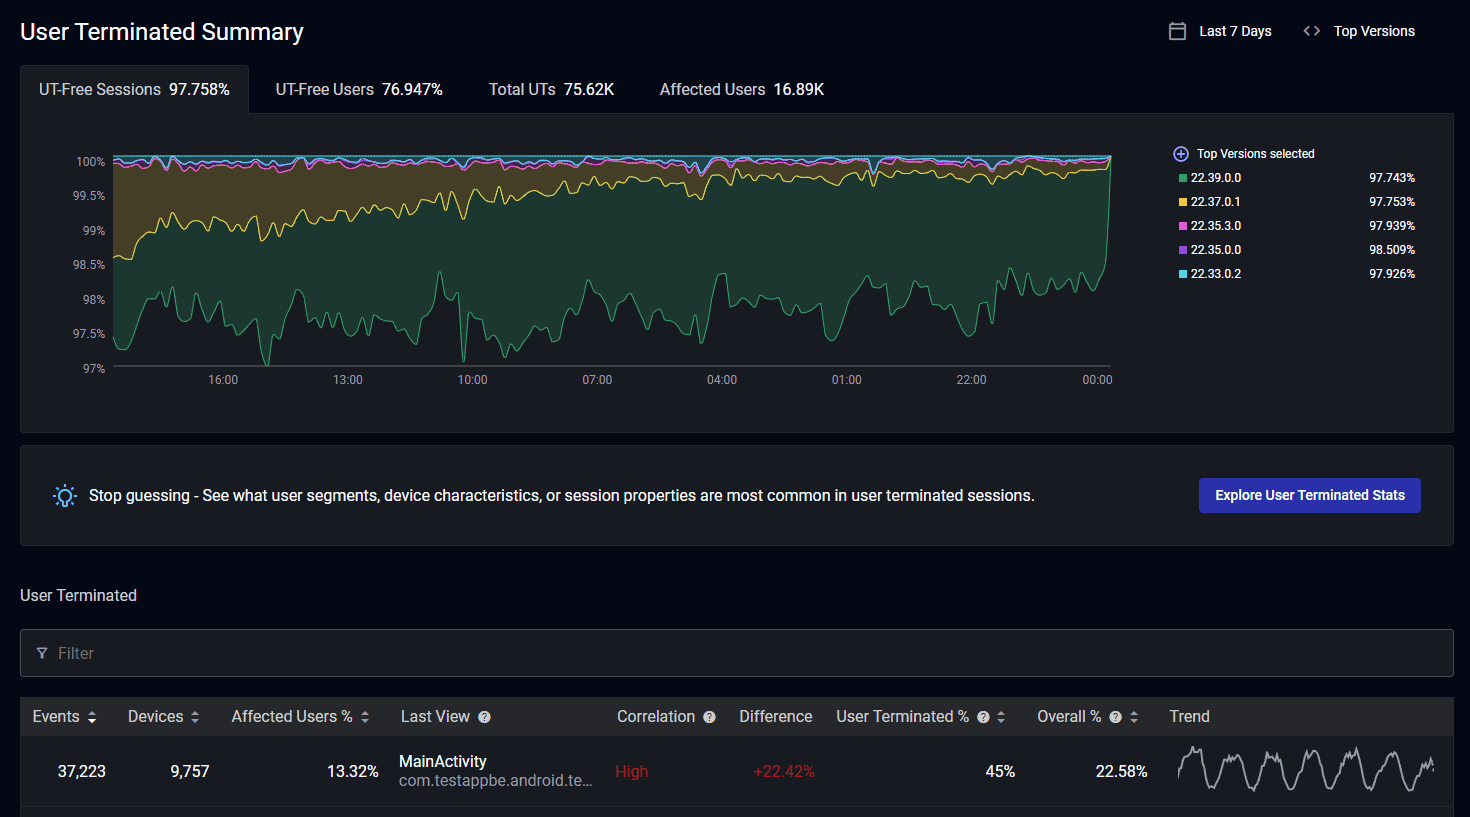
Embrace provides mobile teams with a table with several aggregate user termination metrics, including:
- Total user terminations for all versions selected in the given time period.
- Users affected by user terminations for all versions selected in the given time period.
- Visualization of user terminations counts by version over time.
- Breakdown of user terminations counts by version.
So far, these metrics are broken out by version, but what if mobile teams want to understand user termination patterns across different segments?
Discover insights and patterns with Embrace’s User Terminated Stats page
The user terminated stats page highlights where user terminations are over-indexed on specific attributes, including:
- Device – device the user termination occurred on.
- OS version – OS the user termination occurred on.
- Last captured view – view the user termination occurred on.
- Time of day (UTC) – time in UTC when the user termination occurred.
- Session properties – where user terminations happen concerning predefined key-value pairs.
- Country – country the user termination occurred in.
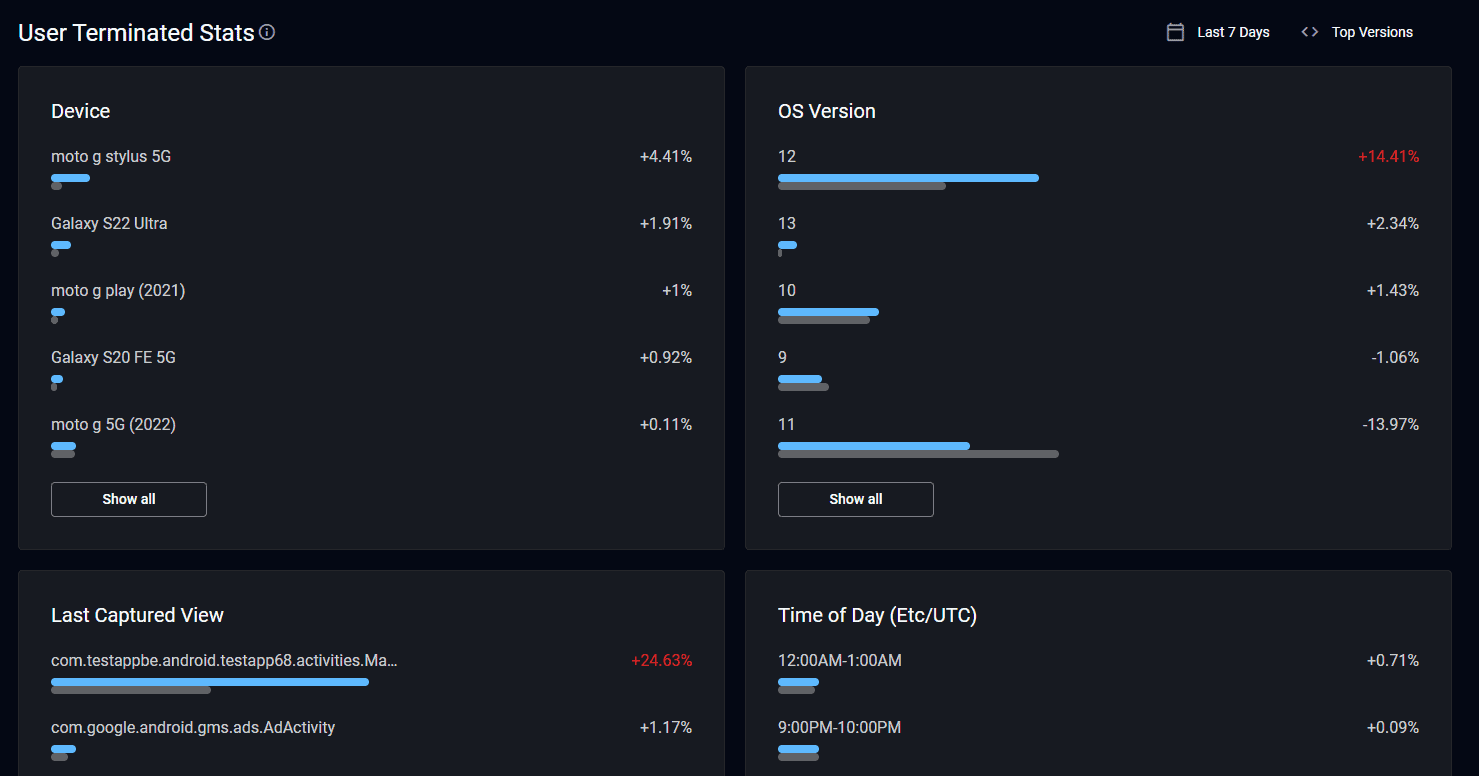
The blue line represents the proportion of total user terminations that occurred with the given attribute. The gray line represents the proportion of total sessions that occurred with the given attribute. Significant differences between the two lines indicate user terminations being over-or under-indexed by that attribute.
As an example, let’s say:
- 70% of sessions end in a user termination on OS 14.7.1
- 5% of total sessions occur on OS 14.7.1
Such a large discrepancy suggests that some interaction between your app and the new OS version may be leading to user terminations. Thus, the user terminations stats page provides high-level context about where user terminations may be disproportionately affecting subsets of your users. In some cases, user terminations that overwhelmingly affect a given attribute can guide your mobile teams toward root causes.
After reviewing these high-level patterns, mobile teams want to dig into more specific datasets. In addition, they want to identify groups of user terminations that they can take action on. After all, without stack traces to go off of, what is the best way to isolate the root cause of user terminations?
Understanding the impact of user terminations across your screens
Embrace provides metrics based on where user terminations disproportionately impact certain screens within your mobile apps. That way, you can understand which screens may be causing user frustration so you can dive in and investigate. Here’s the data that Embrace provides:
- Event count – shows which screens experienced the most user terminations
- Device count – shows which devices experienced the most user terminations
- Affected users % – shows which screens have user terminations that impacted the most users
- User terminated % – shows the percentage of user terminations that ended on a given screen
- Overall % – shows the percentage of sessions that ended on a given screen
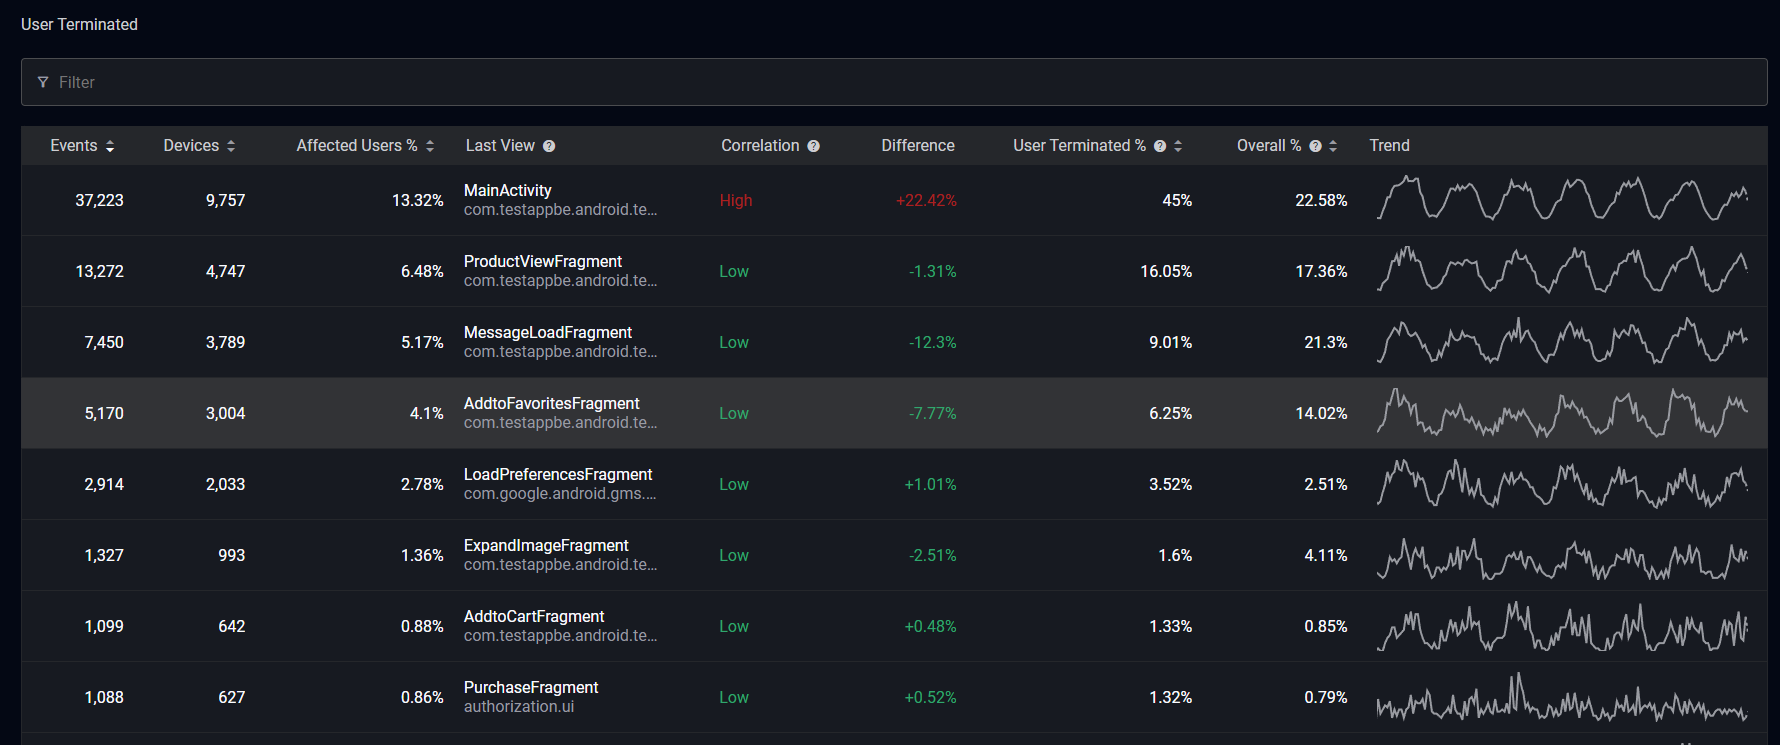
Your mobile teams can also leverage correlations highlighting potential problem areas within your mobile apps. Here’s how it works:
- Embrace knows which screens the app is on when user terminations occur.
- Embrace also knows the baseline of how often a given screen ends a session.
- If the user terminations have nothing to do with the given screen, these frequencies should be close to equal. However, large differences highlight a disconnect between the general usage of a screen and how frequently a user termination occurs there.
What are some insights this approach provides?
- Get the actual user impact and not just raw numbers of events. If many user terminations occur within your app, you want to know how many devices and users are affected. Maybe these user terminations are happening on old devices to a few users, and it’s not worth prioritizing a fix.
- Identify significant opportunities before investing engineering time. You want to focus engineering resources where they will have the largest impact.
- Understand the best place to find the root cause. If user terminations are frequently happening within a specific feature, you can have the feature owners investigate. Instead of blindly guessing, you’re automatically pointed towards the most likely root causes.
You can also refine your search by adding filters. For example, if you are only interested in a particular country, device, build, etc., you can look at the exact dataset you care about to reduce the noise.
Now that you’ve chosen a screen, it’s time to dive into actionable data to get you to the root cause.
Inspect screen-level metrics and distributions with Embrace’s User Terminated Details page
Once you want to investigate a specific screen, you can head to the corresponding user terminated details page, which provides many helpful metrics and visualizations, including:
- Percentage of affected users
- Count of affected devices
- Graph of user terminations count by version over time
- Distributions across devices and OSs
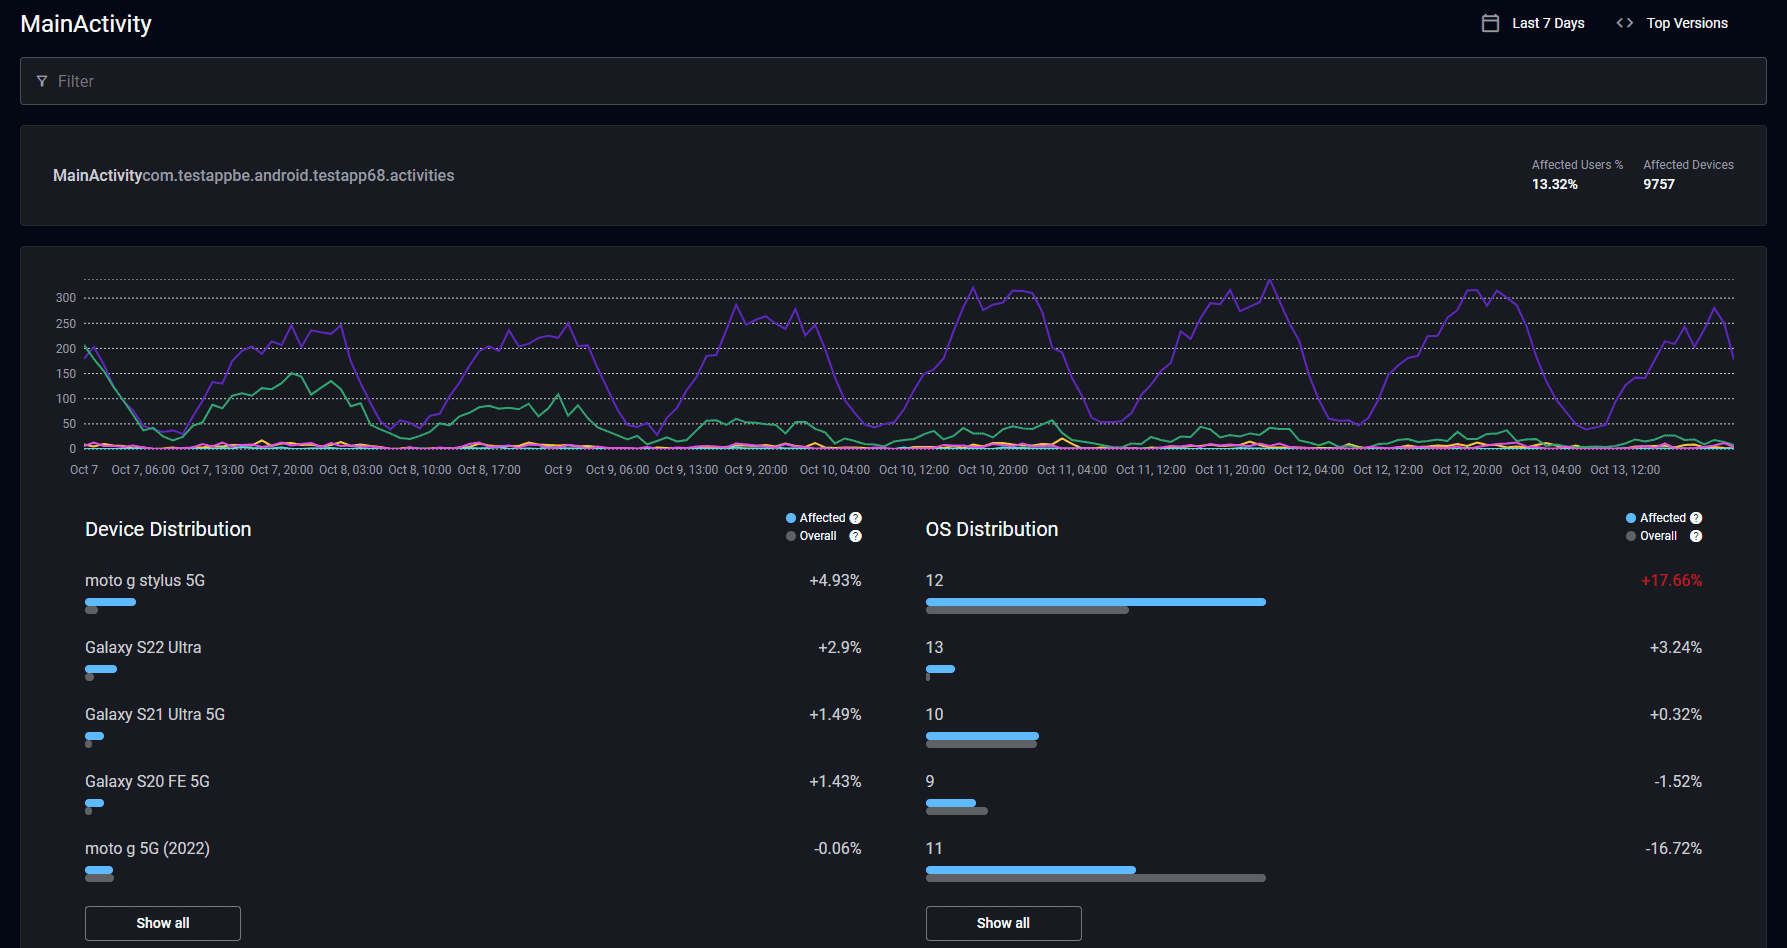
Mobile teams can add filters — your filters will persist across these pages — to find patterns worth investigating. Once you’re ready to inspect the affected user sessions, they are all available to you on this page. You can also quickly scan the other issues that occurred during these sessions for additional context, such as failing network calls, error logs, bad key user moments, and ANRs.
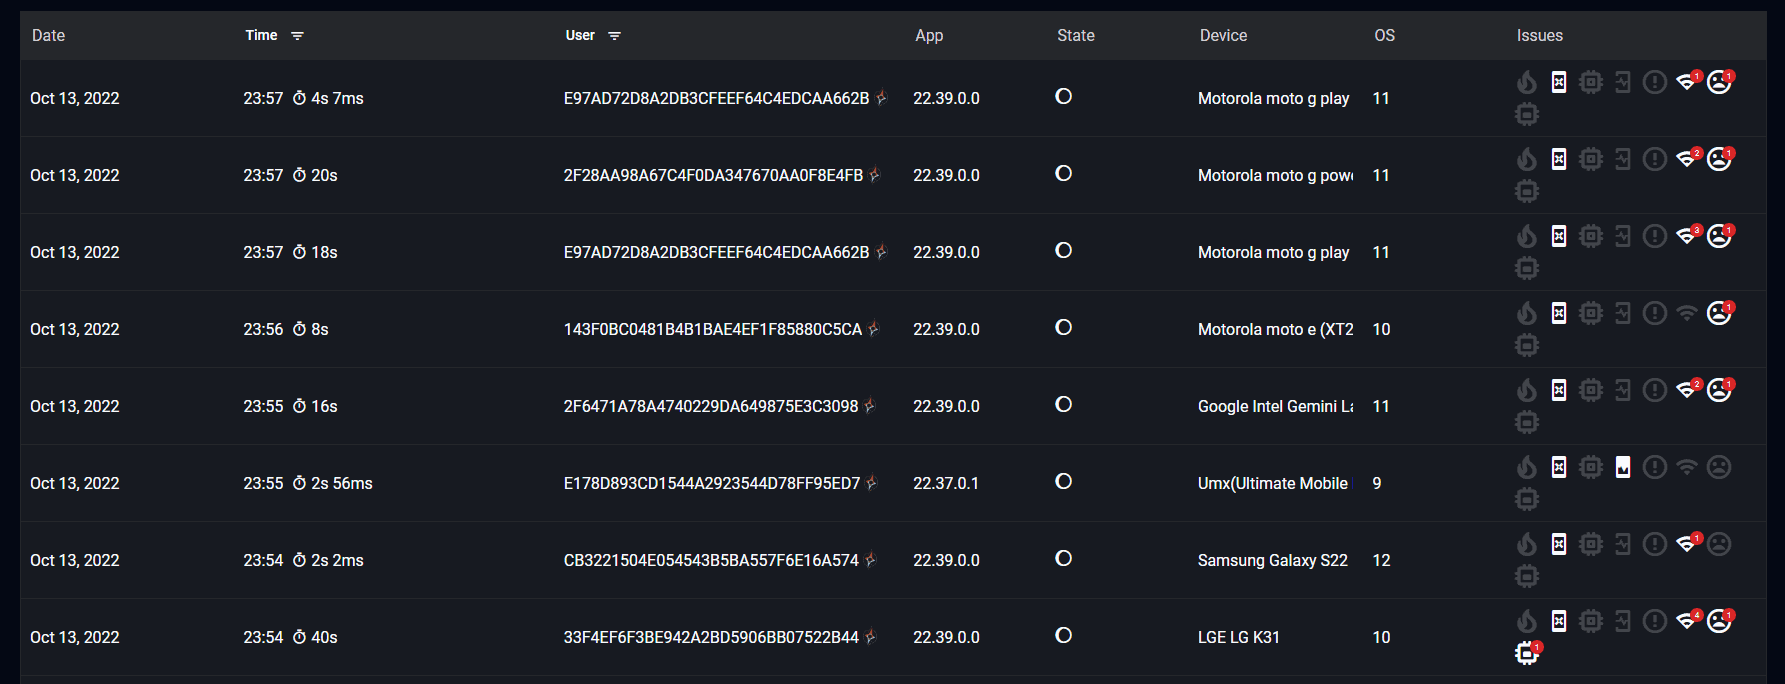
When your team is ready to inspect full session data, they can click into any individual affected session to review the complete user experience.
Dive into complete session details with Embrace’s User Timeline page
All roads lead to the user timeline in the Embrace platform, which highlights every technical event and user action within a session. It allows mobile teams to avoid manually reproducing issues by providing the full context of every user experience. In addition, because Embrace collects 100% of sessions, you have complete data to understand an issue’s impact across your users and business and the underlying diagnostic data needed to remediate it.
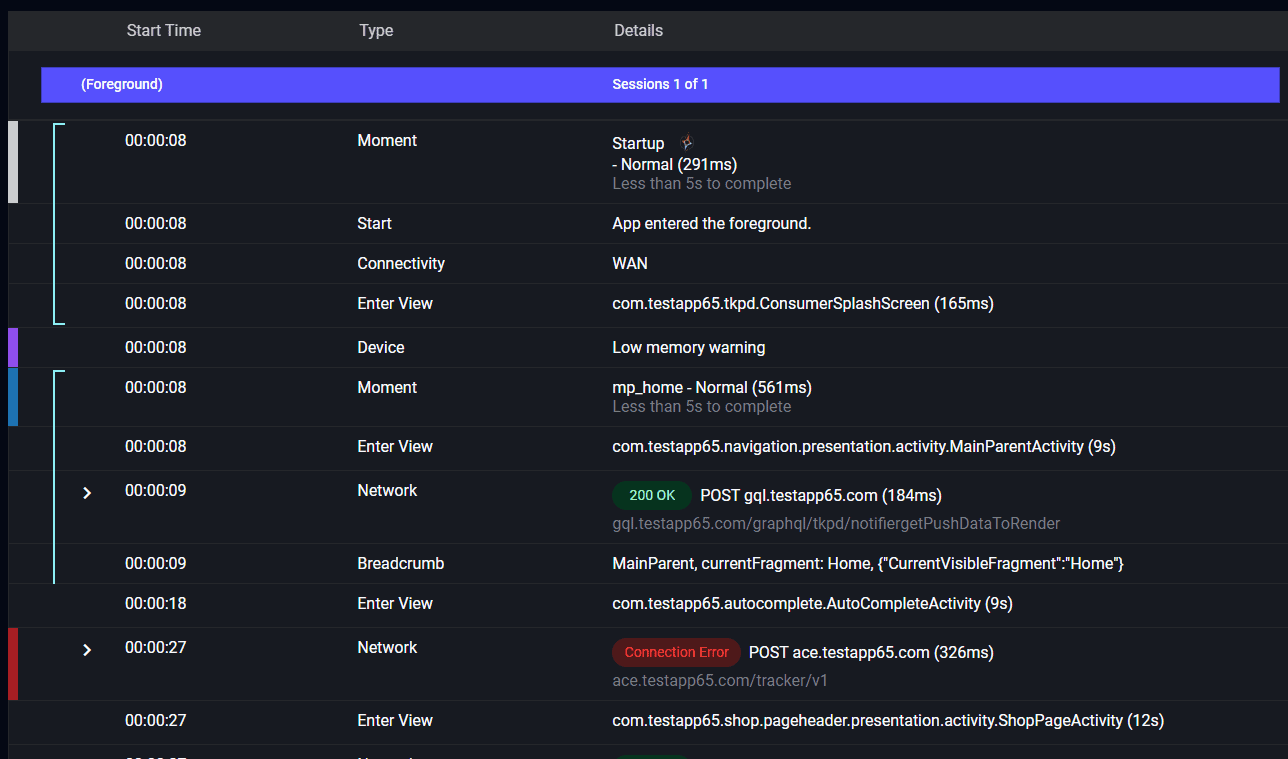
When attempting to find the root cause of user terminations, mobile teams can easily spot issues the user may have experienced within a user timeline, such as:
- Freezes and ANRs
- Failing or blocking network calls
- Errors
- Broken UI elements
- Slow loading screens
Once your mobile team can inspect the full details of what’s happening within the affected session, they can quickly pinpoint the root cause and fix it.
Final thoughts
With Embrace, mobile teams can find the root cause of user terminations by examining complete mobile user experience datasets as opposed to the limited data that event-based monitoring solutions provide. We’ve covered how teams can proactively address user terminations with powerful alerts and real-time dashboards. We’ve also highlighted how Embrace provides actionable insights across versions, devices, OSs, countries, and session properties, to name a few. Mobile teams have full visibility into the impact of user terminations across the screens in their app, where they can immediately dive into the details of every affected user session to pinpoint the root cause. The end result is that mobile teams can identify and prioritize user terminations faster to minimize the impact on their users and business!
If you’d like to see how complete mobile visibility can revolutionize how you deliver incredible mobile experiences, get started with a free trial today.