Delivering a compelling mobile app experience requires visibility far beyond crashes and errors. You’re competing with other apps in your same vertical based upon performance. This is why mobile teams need to wow customers, quickly debug issues, and proactively solve app problems.
If the goal is to have an innovative app, your team needs to be aware of the root causes of app issues. The best way to increase awareness is by collecting data at the session-level as opposed to just individual events. That way, your team is debugging from complete datasets about entire user experiences.
This starts with client-side visibility that takes into account the behavioral and technical factors of every user session. After all, to a user, any negative experience that prevents them from getting value from your app is a recipe for churn. This could be slowdowns, excess data usage, jank, freezes, battery draining, and more. If you cannot investigate every factor that contributes to poor user experiences, then you will struggle to solve root causes in a timely manner.
In this post, we’ll cover the following:
- What is a user session?
- The four key pieces of full user session monitoring in mobile
- Why session timelines provide the best visibility into user experiences
- The value of monitoring both duration and outcome
- The power of stitching sessions into complete user experiences
What is a user session?
A user session occurs any time your app is in the foreground. More precisely, it’s everything the user does from the time they launch the app to the time they stop using the app – it doesn’t matter if the app session ended in a background or a force quit.
You can think about a user session timeline as all the details needed to understand what really happened:
- Device state like CPU, memory, battery, and connectivity
- User journey like views/activities/screens, button presses, and taps
- Technical events like network calls and errors
- Session outcome like crash, ANR, OOM, or force quit

Every mobile team is different and has specific goals and KPIs. This is why the ability to add custom visibility is crucial. Here are a few additional pieces of information you should track in your user sessions:
- Logs and breadcrumbs for additional session context
- The timing and outcome of key user moments like add to cart and purchase
- Experiments and A/B tests by setting session properties
- User personas so you can drill into an issue’s impact across different cohorts

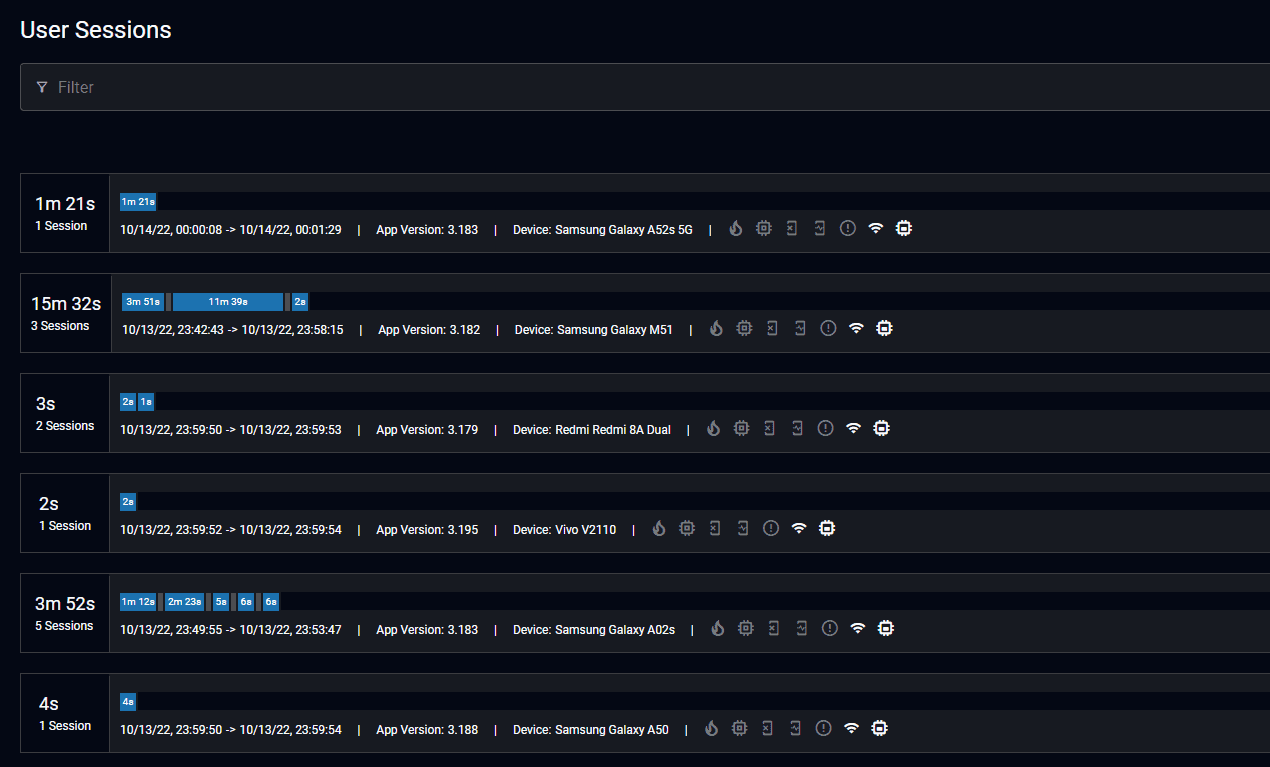
Above, you can see a comprehensive list of mobile sessions and the various factors affecting them. In this instance, many of the app users were negatively impacted by connectivity issues and low memory warnings.
For mobile teams, this visibility enables them to solve many issue types that elude detection by error monitoring solutions. Examples include:
- Where the app fails to gracefully handle connectivity switches
- Freezes and ANRs caused by downloading too much data or performing heavy animations
- Memory issues from poor memory management, downloading unoptimized assets, or failing to properly cache them
- Bloated startup times due to failing or excessive SDKs
- Client-side network call performance, including failure to load ads, images, and videos
The benefit of access to complete user sessions is that mobile teams can easily answer questions and eliminate guesswork. They can track a broader suite of metrics and easily drill down to any individual user experience to understand the complete details. Instead of manually reproducing issues based on limited information, they have the full context of everything that happened.
The four key pieces of full user session monitoring in mobile
When it comes to getting full user sessions, there are four pieces of information needed to get the complete picture. These include:
Device state
The device state refers to the actual conditions of the device as it is running the mobile app. These include factors like CPU, memory, battery, and connectivity.
The device state is important because the mobile space is so vastly different from the web. Mobile sessions need to factor in constraints like device memory. When you have a full user session, you can see how memory limitations contribute to a crash. In addition, crashes can happen when the app doesn’t properly account for low power mode. Without full user session context, your mobile team might waste precious time going down rabbit holes when the root cause ultimately stemmed from specific device conditions.
User journey
The user journey refers to the user flow throughout the app. This includes factors like views/ screens/activities, taps, and button presses.
Many types of issues depend on which areas of the app a user visits and what they do there. For example, rapidly scrolling through too many products could introduce freezes as the UI struggles to continually stay up to date. In addition, crashes can easily happen from exceeding memory limits in a certain area of the app.
Technical events
Technical events refer to what code is running. This includes logging errors, tracking app state through breadcrumbs, or firing network calls.
Additional events here include monitoring when the UI is frozen, which can happen from network congestion, too much work on the main thread, or heavy data processing or animations being done on the client.
Session outcome
The session outcome is how the individual user experience ends. This could be positive, such as a user completing a purchase and backgrounding the app. It could be neutral, such as the user backgrounding the app to answer a call before returning. It could also be negative, such as an OOM, ANR, force quit, or crash.
In many mobile monitoring tools, the session outcome is the majority of the data the mobile team receives. However, with full user sessions, teams can diagnose every way these negative session outcomes occur. For example, you can understand easily which ANRs stem from excessive networking versus heavy processing.
NOTE: Many mobile monitoring solutions will collect limited types of data. This prevents teams from having the information needed to solve issues efficiently.
Why session timelines provide the best visibility into user experiences
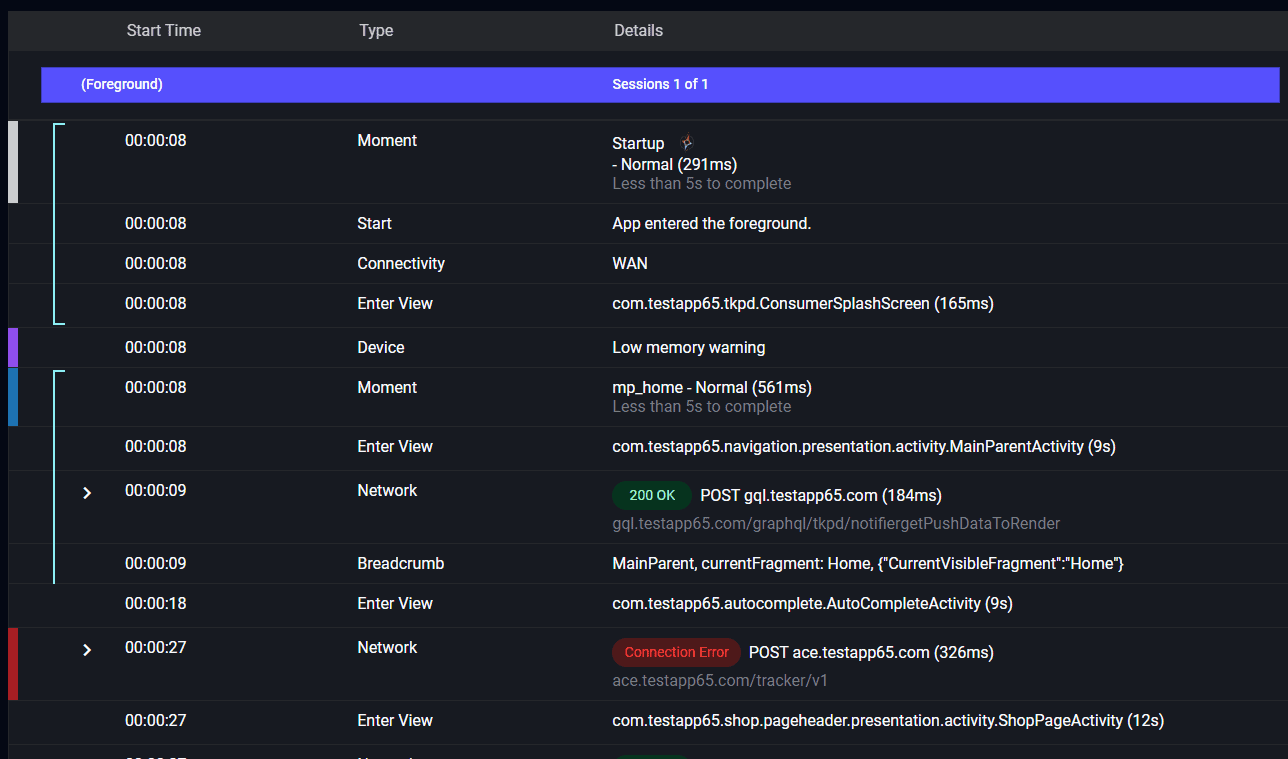
Having full user sessions makes creating actionable solutions from user complaints easy. After looking up a user ID, you can click into the session and head to the session timeline page for further insight into your app performance. This not only includes a list of logs, but the timing and order of all technical events and user actions within the mobile app experience.

Here, you can delve further into the full session and spot things like:
- Which network calls were slow or had errors
- Which network calls were firing at the same time
- Where freezes and ANRs began
- Where logs and taps happen
- Where device state changes like connectivity switches or CPU pegging begin
You don’t want the individual logs alone – you need all of the factors in a unified view. This way, you eliminate the need for your team to manually reproduce issues. When you have the full experience right at your fingertips, you greatly reduce the time it takes to get to the root cause and put out a fix.
The value of monitoring the order, duration, and outcome of events
In mobile, negative user experiences are not always clear-cut. For example, if your startup time increases by 1 second, what is the outcome to your business? Will a large segment of users choose to abandon your app and head for a quicker one? Is that half as bad as a 2 second increase? Just relying on the duration is not enough information to make key decisions.
By monitoring both the duration and outcome of key moments within your mobile apps, you can spot performance regressions alongside their associated negative business outcomes. That way, you know which issues deserve immediate attention. Examples include:
- Your purchases start taking 10 seconds longer to complete, and you can count how often users decide to cancel purchases due to frustration.
- Certain screens start taking 5 seconds longer to load, and you can monitor what the reduction in user engagement is. You can spot how much less often users visit those screens and how quickly they abandon your app when they get there.
- One of your key engagement actions (e.g. uploading a photo) starts taking 6 seconds longer. You can easily spot a drop in photo uploads across your users, which results in few app launches and shorter session durations.
By connecting user outcomes to the regressions in your mobile app, you can better prioritize the issues that will have the largest impact on your business.
For example, a hotel microstay platform noticed their booking time was taking 20 seconds to complete. Their mobile team prioritized this issue because they also saw a drop in completed bookings. With Embrace, they reduced their booking time down to 5 seconds, immediately increasing overall bookings by 3%.
The power of stitching sessions into complete user experiences
In mobile, users frequently jump in and out of mobile apps. In order to understand a complete experience, you need to see several foreground sessions side-by-side. This is where “stitched sessions” come into play.

In this session, you can see the user bring the app to the foreground 15 times in the span of 13 minutes, and a crash occurs in the twelfth session. Conditions in previous sessions frequently lead to crashes in later ones. Having full access to the complete user experience before and after the error makes problem solving easier because you’re fully aware of all factors surrounding this issue.
Here are some instances where a stitched session becomes useful:
- Solving a crash in a later session where the root cause was a failure in a previous session
- Tracking down where multi-step IoT integrations are experiencing failures
- Uncovering where state mismatches and data loss is occurring in frequently-used productivity apps
- Identifying the cause of OOMs as poor memory management across multiple sessions
- Discovering where unintentional logouts in previous sessions are causing poor experiences in subsequent launches
The benefit of “stitched sessions” is their ability to show the natural flow of a user using your app. This visibility allows you to fully understand the user experience while eliminating the burden of recreating it. These sessions also show you problem areas within the app and allow you track down the source of user problems.
Why choose Embrace for your mobile app?
Embrace empowers companies to make informed business decisions through complete mobile datasets. By collecting 100% of the data from 100% of user sessions, Embrace is the only data-driven toolset that empowers mobile engineers to eliminate guesswork when identifying, prioritizing, and solving issues that lead to every type of poor user experience. Here are just a few key benefits that Embrace can provide to your mobile teams:
- Proactively respond to all regression types (e.g. stability, performance, health, engagement, and adoption) in real-time at the thresholds and time windows that minimize noise
- Immediately go from any user complaint to the root cause, including the issue’s impact across your users and business
- Uncover every factor that contributes to poor user experiences, user frustration, and churn
- Monitor KPIs and SLAs with custom dashboards so stakeholders can know when a spike deserves immediate attention.
- Track app performance and outcomes across the segments you care about, such as user personas, countries, devices, versions, and OSs.
With Embrace’s full user session insights, you’ll have the complete details for every user experience, including device state changes, user journeys, technical events, and every type of session outcome (not just crashes and errors). By removing guesswork and data gaps in favor of complete visibility, your mobile teams can focus on creating value and growing the business.
If you’d like to see how complete user sessions can revolutionize how you deliver incredible mobile experiences, get started with a free trial today.


