Core Web Vitals transformed how entire organizations think and talk about web performance. Mobile deserves an equivalent framework — one that's rigorous, user-focused, and tied to real business outcomes. We're building it. Here's how.
We surveyed 300 frontend engineering teams. 89% use AI in their workflows, but only 8% apply it to observability. See what drives the gap and how your team compares.
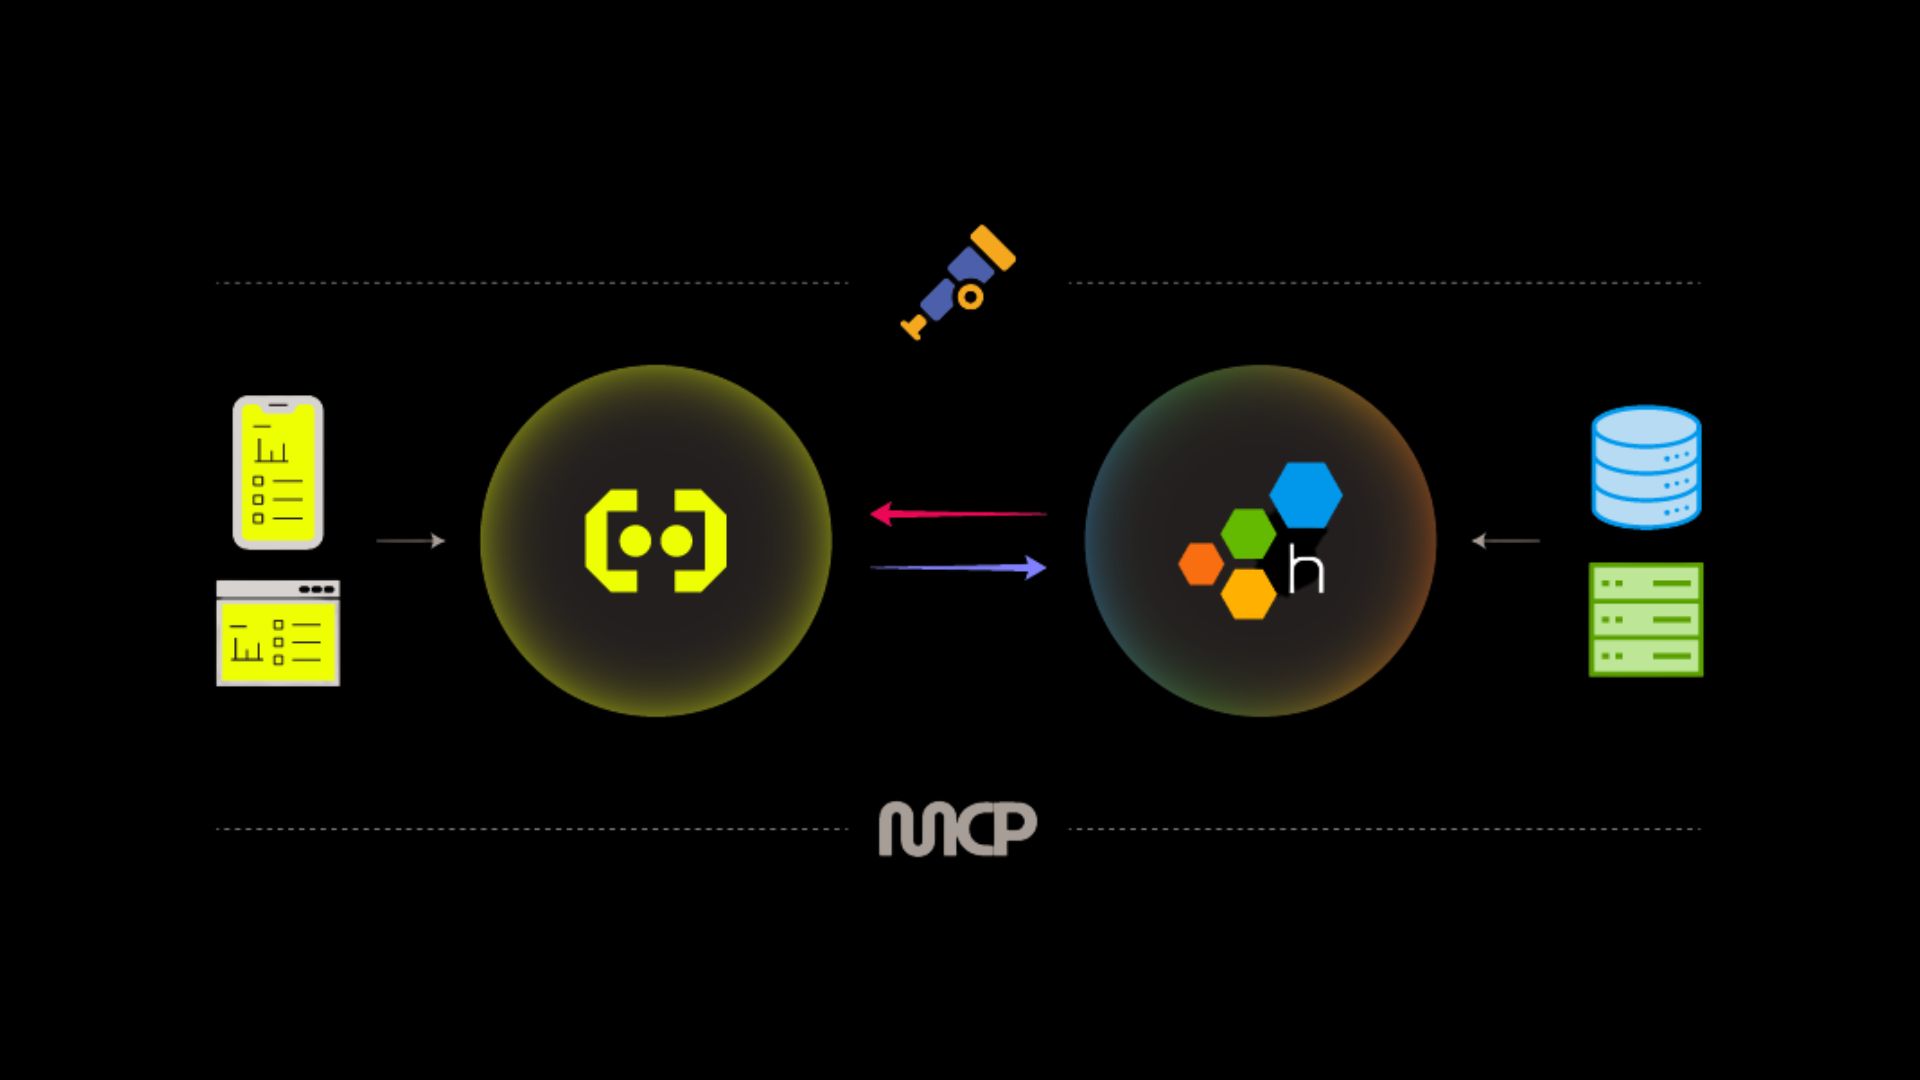
A new strategic partnership with Honeycomb brings Embrace's web and mobile RUM together with industry-leading services observability, so engineering teams can finally follow a problem from the backend straight to the users feeling it.
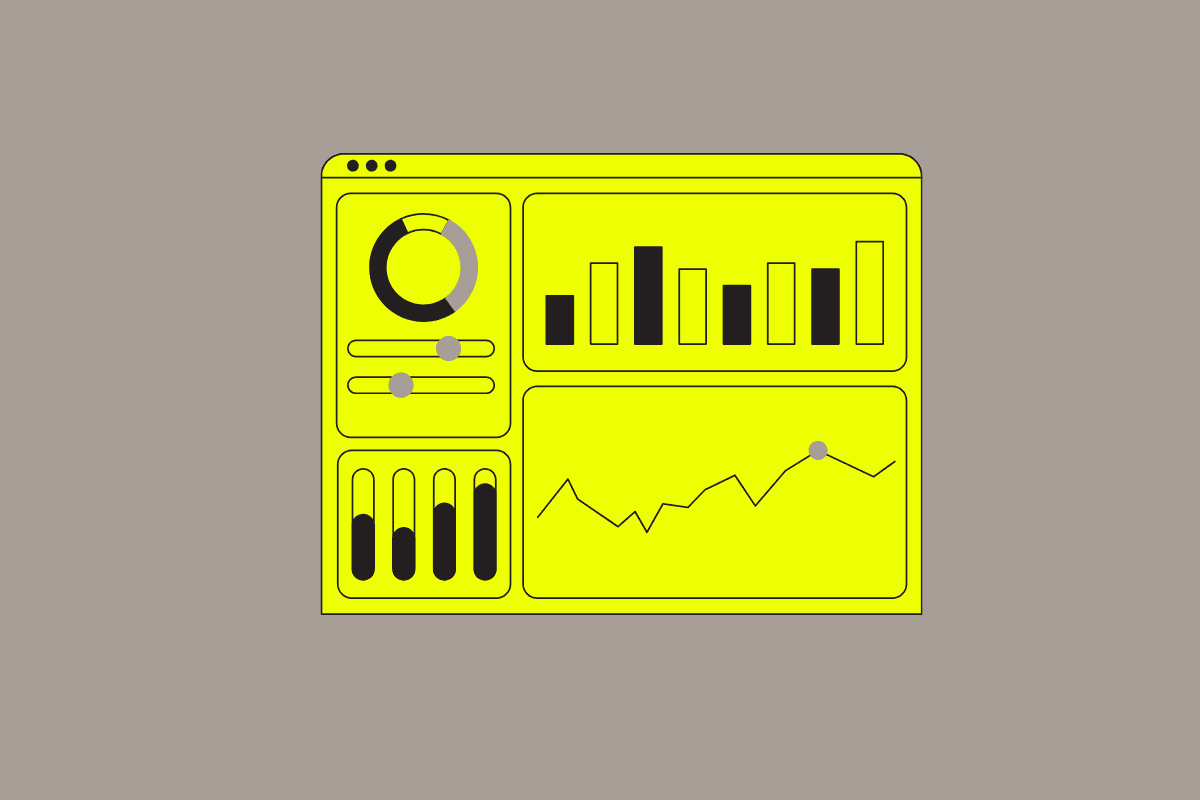
Custom Dashboards have always given engineers the flexibility they need to do their own analysis, explore trends, and share insights across their orgs. Now, we've given this crucial feature a serious upgrade. New chart types, more powerful filters, better searchability, and an overall more streamlined experience make Custom Dashboards all the more useful for our customers.
Whether you are a developer, product manager, or business leader, effective mobile APM ensures your app runs smoothly, meets user expectations, and supports your business objectives.